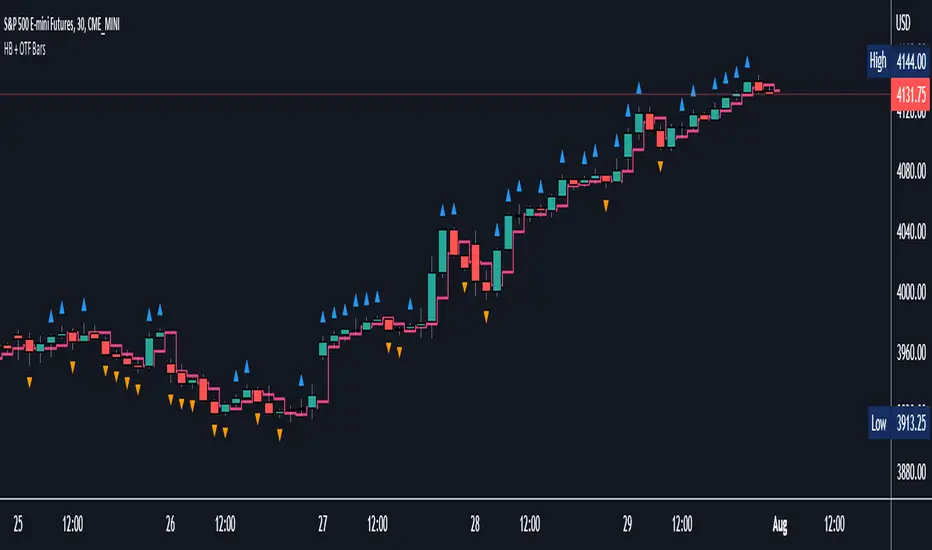
Halfback + One-Time-Framing BarsThis indicator is designed to be used with Market Profile / Volume Profile trading techniques on a 30min chart.
The halfback of a candle is the mid point between the high and the low of the candle. A halfback trade can be taken once price retraces into this point as support/resistance using the prevailing trend as your trade direction.
One-Time-Framing is a fancy term for trending in one direction. One-Time-Framing happens when a candle breaks the previous candle's high without testing the low or when a candle breaks the low of the previous candle without testing the high. This indicates that the trend is one directional and opposing pressure is very weak. Taking trades in the opposing direction of multiple OTF bars is typically a bad trade setup.
Halfback and OTF setups are typically used on a 30min timeframe combined with Market or Volume Profile, but you can experiment with these setups on any timeframe if you wish.
I hope you all enjoy this indicator, comment below if you have any questions.
Pesquisar nos scripts por "volume profile"
Koalafied Volume Extension BubblesCircles based on extensions from volume Z-Score. Large volume candles can often signal exhaustion or show market strength in reversals or breakouts. Circles can be offset back to the start of the day/profile or left at the time where they occur.
Colours denoting deviations from the mean are
+2 std dev - Green
+1 std dev - Blue
-1 std dev - Red
-2 std dev - Purple
Concept is primarily as a pseudo volume profile delta tool. Obviously it's a very basic heuristic so would recommend further reading and use of actually footprint data to base trading decisions on.

Swing Assassin's Consolidated ScriptI put this script together to essentially consolidate a number of scripts that I use on a daily basis into one script. This is an ongoing improvement effort, so there may be some garbage in here right now so keep that in mind if you intend to use this to help in your trading.
There are 5 moving averages (Hull). I use the Fast, Mid and Slow to find entries after I us the Medium Slow and Super Slow to identify a trend. Otherwise, I have those three turned off.
This script also uses Bollinger Bands which I literally cannot trade without.
The script also has anchored VWAP , automated support/resistance lines, and a homebrewed Volume Profile that is a copy from Ildar Akhmetgaleev's indicator "Poor Man's Volume Profile" used under Mozilla Public License Version 2.0.

Poor man's volume clustersVolume clusters created from candlestick volumes.
See also "Poor man's volume profile" .
The code is generated using a template. To change the settings, you may need to regenerate the code. The code has a link to the repository with the template.

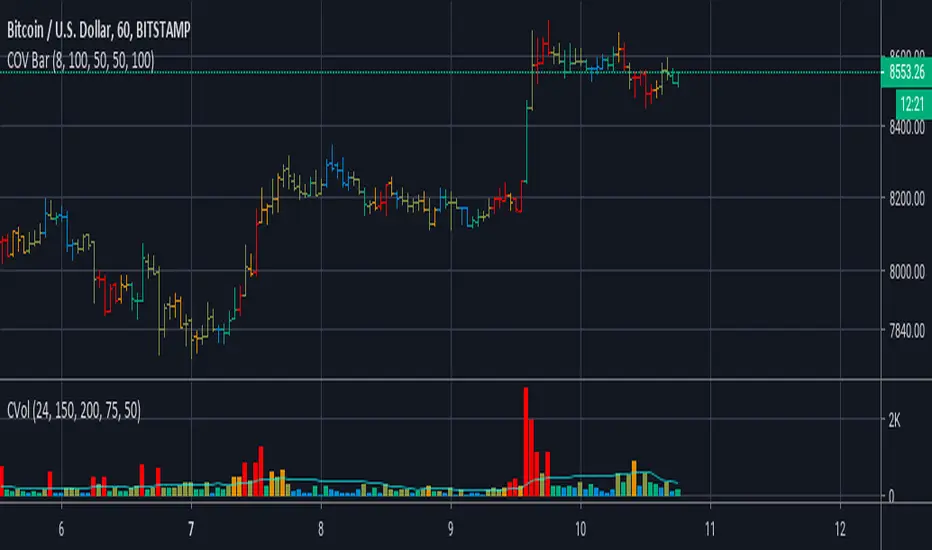
Cumulative Overlapping Volume BarsThis is cheap replacement for volume profile.
Red bars is where accumulated high volume in small range.
if new bar moves out of range all accumulated volume will be lost and color will change.
Delta Volume Columns [LucF]Displays delta volume columns using intrabar volume information. Each volume column is divided into three sections: buying, selling and neutral volume. Volume for each section is determined from the volume and price movement of each intrabar at a user-selected lower resolution.
Features include:
- Choice of color themes for either dark or light chart backgrounds
- Delta volume columns
- Volume Balance displayed as the difference between the MAs of buying and selling volume
- Display of divergences between a bar’s volume balance and the bar’s price movement (example: buying volume > selling volume but close < open). Divergences can be shown in 2 different color schemes (including green/red showing a tentative direction), on volume columns and/or on chart bars
- Display of bar by bar volume balance with highlighting of above average volume
- Display of the usual total volume MA
- Choice of the lower resolution used to retrieve intrabar information
- Alerts configurable on any combination of the markers, with control over long/short direction
- Choice of 3 different markers:
1. Double bumps: two consecutive bars where buying or selling volume is in the same direction and where volume > volume MA
2. Divergence confirmations: direction of the price bar following a price/volume balance divergence
3. Volume balance shifts: zero level crossings of the volume balance MA delta
The chart shows the two main modes of display:
- Top pane : shows the stacked volume columns with divergences in orange and the flattened volume balance MAs delta at the bottom of the volume columns. This volume balance is the same shown in the bottom pane. The top pane also shows the instant volume balance strip above the volume columns. The strip’s colors show which of the buying or selling volume was greater, and colors are brighter if the total volume was above the total volume MA.
- Bottom pane : shows the volume balance MAs delta with markers 1 and 2. Given that this graphic has no price momentum component, I find quite eerie how it often looks like a momentum-based signal.
The default 5 minute intrabar resolution is used in combination with the weekly chart, which is excessive.
This script uses a special characteristic of the security() function’s behavior when it is sent to a resolution lower than the chart’s resolution. Details are given in the script’s comments. This method has the advantage of working under more circumstances than some of the other loop-based methods, but it also has its limits.
IMPORTANT
This is what you need to know:
- The method used does not work on the realtime bar—only on historical bars. Consequently, the volume column shown on the realtime bar is a normal volume column plotted in green or red, following price movement. The column will only show delta volume information after it closes and becomes a historical bar.
- The indicator only works on some chart resolutions: 5, 10, 15 and 30 minutes, 1, 2, 4, 6, and 12 hours, 1 day, 1 week and 1 month. The script’s code can be modified to run on other resolutions, but chart resolutions must be divisible by the lower resolution used for intrabars.
- Intrabar resolutions can be selected from 1, 5, 15, 30, 45 minutes, 1, 2, 3, 4 hours, 1 day, 1 week and 1 month. The intrabar resolution must of course be smaller than the chart’s resolution.
- Contrary to my other indicators where alerts must be configured to trigger “Once Per Bar Close” in order to avoid false triggers (or repainting), all this indicator’s alerts are designed to trigger using previous bar information since the indicator’s calculations in the realtime bar are not exact. Markers are not plotted with a negative offset; they appear at the beginning of the realtime bar following confirmation of the marker’s condition on the previous bar. Alerts for this indicator should thus be configured to trigger “Once Per Bar” so they trigger at the beginning of the realtime bar. Note that the penalty is not that great, as it is simply the instant between the close of the previous realtime bar and the opening of the next. The advantage of using this technique is that the indicator does not repaint; a marker that appears at the beginning of the realtime bar will never disappear.
- The script only plots information that is reliable in the realtime bar, i.e., total volume and markers. All other plots are set to n/a to prevent misleading traders.
- When the difference between the chart’s resolution and the lower resolution is too important, volume columns will not calculate for all bars in the dataset.
On Delta Volume
Buying or selling volume are misnomers, as every unit of volume transacted is both bought and sold by 2 different traders. There is no such thing as “buy only” or “sell only” volume, but trader lingo is riddled with original fabulations.
Without access to order book information, traders work with the assumption that when price moves up during a bar, there was more buying pressure than selling pressure. The built-in volume indicator available on TradingView uses this logic to color the volume columns green or red. While this script’s numbers are more precise because it analyses a number of intrabars to calculate its information, it uses the exact same imperfect logic to calculate its buying/selling/neutral sections.
Until Pine scripts can have access to how much volume was transacted at the bid/ask prices, our so-called buying/selling volume information will always be a mere proxy.
Divergences
You may wonder how there can be divergences between buying/selling volume information and price movement. This will sometimes be due to the methodology’s shortcomings we have just discussed, but divergences may also occur in instances where because of order book structure, it takes less volume to increase the price of an asset than it takes to decrease it.
As usual, divergences are points of interest because they reveal imbalances, which may or may not become turning points. I do not share the overwhelming enthusiasm traders have for divergences. To your pattern-hungry brain, the orange bars this indicator shows on chart will—as divergences on other indicators do–appear to often indicate turnarounds. My opinion is that reality is generally quite sobering, as many who have tried building automated rules based on divergences will tell you. I do not have hard numbers on the lack of performance of divergences—only many failed attempts to make them perform, which a few experienced strategy modelers I know share with me. Please don’t try to read too much into them. While they look great on past data, I find they are often difficult to use in realtime to make bets with good odds.
Thanks to:
- A guy called Kuan who commented on a Backtest Rookies presentation of an intrabar delta volume indicator using a for loop. The heart of “my” indicator is code borrowed from Kuan; I just built a hopefully useful wrapper around it.
- @theheirophant, my partner in the exploration of the sometimes weird abysses of security() ’s behavior at lower resolutions.

Moonboys BTC Liquidation Heatmap═════════════════════════════════════════════════════════════
MoonBoys BTC LIQUIDATION HEATMAP
═════════════════════════════════════════════════════════════
Visualize high-probability liquidation zones across Bitcoin futures markets using multi-exchange data and algorithmic pivot detection.
═══ OVERVIEW ═══
This indicator tracks where leveraged positions cluster and highlights areas where cascading liquidations are likely to occur. By combining Open Interest data from major exchanges with volume-weighted pivot analysis, it shows you where the market's leverage is stacked before price gets there.
Perfect for:
• Anticipating volatility zones
• Identifying potential reversal areas
• Avoiding stop-hunt regions
• Confirming breakout/breakdown levels
═══ KEY FEATURES ═══
🎨 HEAT-MAPPED LIQUIDATION ZONES
└─ Green zones = Long liquidations (below price)
└─ Purple zones = Short liquidations (above price)
└─ Color intensity = Volume significance
⚡ SMART SIGNIFICANCE DETECTION
└─ Top 30% of levels automatically highlighted
└─ Lightning bolt icon (⚡) marks critical zones
└─ Enhanced with borders, brighter colors, and bold labels
└─ Weak levels stay subtle to reduce noise
📊 MULTI-EXCHANGE DATA
└─ Binance Futures Open Interest
└─ Bybit Futures Open Interest
└─ Coinbase Spot Volume
└─ Toggle exchanges individually
🕐 MULTI-TIMEFRAME COMPATIBLE
└─ Works on all timeframes: 1m to Monthly
└─ Auto-adjusts filters and aggregation per timeframe
└─ Consistent performance across different chart scales
🎯 CLEAN VISUAL DESIGN
└─ Labels positioned right of chart (off candles)
└─ Connector lines show which label belongs to which zone
└─ Hit levels fade automatically
└─ Only active zones are labeled
═══ HOW TO READ IT ═══
┌─────────────────────────────────────────────────────────┐
│ ZONE TYPE │ MEANING │
├─────────────────────────────────────────────────────────┤
│ 🟢 Green (below) │ Long liquidation cluster │
│ │ → Potential bounce/support zone │
├─────────────────────────────────────────────────────────┤
│ 🟣 Purple (above)│ Short liquidation cluster │
│ │ → Potential rejection/resistance │
├─────────────────────────────────────────────────────────┤
│ ⚡ With icon │ Top 30% most significant levels │
│ │ → Higher probability of reaction │
└─────────────────────────────────────────────────────────┘
═══ TRADING APPLICATIONS ═══
📈 TREND CONTINUATION
→ Price rejects from liquidation zone = trend strength
→ Watch for bounces at green zones in uptrends
→ Watch for rejections at purple zones in downtrends
🔄 REVERSAL SETUPS
→ Price diving into dense liquidation clusters
→ Heavy volume + liquidation zone = potential turning point
→ Combine with momentum divergence for confirmation
⚠️ RISK MANAGEMENT
→ Avoid entries near untouched significant levels
→ High probability of stop hunts and slippage
→ Wait for price to sweep and confirm before entry
🧩 CONFLUENCE TRADING
→ Layer with support/resistance
→ Combine with volume profile nodes
→ Use alongside order flow indicators
→ Validate with moving averages or trend tools
═══ SETTINGS GUIDE ═══
📡 DATA FEEDS
├─ Binance Futures OI: Toggle Binance data
├─ Bybit Futures OI: Toggle Bybit data
└─ Coinbase Spot Vol: Toggle Coinbase data
🔍 LIQUIDATION DETECTION
├─ Lookback Bars (100-2000): Historical scan range
├─ Pivot Width (1-20): Detection sensitivity
│ └─ Higher = fewer, stronger levels
├─ Target Leverage Tier: Distance from pivot
│ ├─ 25x-50x: 2-4% zones
│ ├─ 50x-100x: 0.8-2% zones (default)
│ └─ 100x+: 0.3-0.8% zones
├─ Min Activity Filter: Remove weak signals
└─ Extend Levels (0-200): Project zones forward
🎨 VISUAL OPTIONS
├─ Long/Short Colors: Customize zone colors
├─ Heat Contrast (0.1-3.0): Intensity scaling
├─ Significance Threshold (0.3-0.95): Top % to highlight
├─ Touched Transparency: Fade amount for hit levels
└─ Label Offset: Distance from chart edge
═══ HOW IT WORKS ═══
1. PIVOT IDENTIFICATION
Scans historical data for swing highs/lows using pivot detection
2. VOLUME AGGREGATION
Combines Open Interest + Volume at each pivot point
Creates weighted metric for liquidation probability
3. ZONE PROJECTION
Calculates liquidation bands based on selected leverage tier
Projects zones where stop losses are likely stacked
4. SIGNIFICANCE RANKING
Normalizes all levels against historical range
Top percentile gets enhanced visual treatment
5. REAL-TIME TRACKING
Monitors price interaction with each zone
Active zones extend forward | Hit zones fade and lock
Memory management removes outdated levels
═══ BEST PRACTICES ═══
✅ DO:
• Use on high-liquidity BTC pairs (BTCUSDT, BTCUSD)
• Combine with volume and order flow analysis
• Look for confluences with key technical levels
• Use higher timeframes for more reliable zones
• Adjust leverage tier based on market volatility
❌ DON'T:
• Trade liquidation zones blindly without confirmation
• Ignore broader market context and trend direction
• Overtrade every single level that appears
• Use as sole entry/exit criteria
• Forget proper position sizing and risk management
═══ TECHNICAL NOTES ═══
• Built with Pine Script v6
• Max 500 boxes, 100 labels for optimal performance
• Auto-scales for different timeframe data availability
• Uses request.security() for multi-exchange aggregation
• Dynamic memory management prevents chart lag
═══ DISCLAIMER ═══
This indicator visualizes potential liquidation zones based on historical volume and open interest data. It does NOT:
• Predict future price movements with certainty
• Guarantee reversals or continuations
• Provide buy/sell signals
• Replace proper risk management
Liquidation zones show where leverage is concentrated — not where price will definitely react. Always use this tool as part of a comprehensive trading strategy alongside technical analysis, risk management, and market context.
📚 EDUCATIONAL USE ONLY | NOT FINANCIAL ADVICE
═══ RESOURCES ═══
Pine Script Documentation
→ www.tradingview.com
Understanding Liquidations
→ academy.binance.com
Open Interest Data
→ www.coinglass.com
Leverage Trading Education
→ www.investopedia.com
═══════════════════════════════════════════════════════════
Built for the Bitcoin trading community 🚀
Because knowing where the leverage sits is half the battle 💎
═══════════════════════════════════════════════════════════

Order Flow CandlesOrder Flow Candles is an advanced candle coloring indicator that visualizes the strength and direction of market pressure on each bar. Unlike traditional candlestick charts that simply show whether price closed higher or lower than it opened, this indicator reveals the intensity of buying or selling pressure through a gradient color system. The indicator employs custom formulas that combine two independent analysis methods—price action scoring and order flow analysis—to produce a pressure reading that determines each candle's directional color intensity.
-------------------------------------------------------------------
The Dual Analysis Approach
This indicator stands apart from simple candle coloring tools by using two distinct analytical layers that work together:
Price Action Analysis evaluates each candle's structure and compares it to multiple previous candles. Rather than looking at a single bar in isolation, the indicator examines how the current candle's size and values compare across several prior bars to establish context. This multi-candle approach helps distinguish between genuine momentum and single-bar noise. The analysis considers factors such as whether the candle is extending beyond previous ranges or failing to do so, whether the candle size indicates conviction or indecision, and whether the overall range suggests strength or weakness. Proprietary adjustment algorithms then modify the raw score based on candle characteristics—smaller, weaker candles receive reduced scores while larger conviction candles receive appropriate emphasis. Gap bars at market open are handled separately to prevent misleading readings from overnight price changes.
Order Flow Analysis examines lower timeframe data to determine actual buying versus selling volume within each chart bar. By analyzing price movements and their associated volume on a granular level, the indicator classifies activity as buying pressure or selling pressure. This raw data is then normalized using adaptive calculations based on rolling historical averages, allowing the indicator to respond appropriately to current market conditions rather than relying on fixed thresholds that may not suit all instruments or market environments.
The two scores are then blended together based on user preference, creating a combined pressure reading that benefits from both analytical perspectives.
-------------------------------------------------------------------
Understanding The Color System
The indicator uses a 10-tier gradient in each direction:
Bright Green - Strong buying pressure with high conviction
Medium Green - Moderate buying pressure
Dim Green - Weak buying pressure or mixed signals
Gray - Neutral—no significant directional pressure
Dim Red - Weak selling pressure or mixed signals
Medium Red - Moderate selling pressure
Bright Red - Strong selling pressure with high conviction
The key insight is that candle direction alone does not tell the full story. Strong candles with strong directional volume and movement will show bright colors to represent the strength of that candle’s direction. Weak and indecisive candles will appear darker to indicate that there was a lack of directional conviction.
The colors used can be customized by setting the bullish color, bearish color and base color. The base color will be mixed with the directional color when directional conviction is low.
-------------------------------------------------------------------
How To Use This To Trade
Trend Confirmation and Trade Management
Bright colored candles indicate strength and conviction. When you see consecutive bright candles in the same direction, this suggests sustained momentum worth riding. During these moves, consider trailing your stop loss tightly to protect profits while allowing the trend to continue. The brightness of the candles serves as a real-time gauge of how much conviction remains in the move.
Reversal Detection
Reversals typically do not occur suddenly. Watch for a darkening of colors leading up to potential reversal points. Darker, dimmer candles indicate indecision and combative pressure from both buyers and sellers. When bright candles begin transitioning toward gray or dim colors—especially at key support/resistance levels—this often precedes a change in direction. A sequence like bright → medium → dim → gray suggests momentum is fading and a reversal or consolidation may follow.
Entry Identification
Large bright candles appearing at pivot points or key levels often represent strong entry opportunities. These candles show that one side has taken decisive control with conviction. When price reaches a significant support or resistance level and produces a bright candle in the expected direction, this confluence of price level and pressure confirmation can provide higher-probability entries.
Detecting False Moves
One of the most valuable applications involves watching for color-to-direction discrepancies when using volume weighting. If you see a green candle (close above open) but the indicator colors it toward red or gray, this means the underlying volume pressure contradicts the candle's direction. This divergence suggests the move may be false and could soon reverse. The order flow component is detecting selling pressure despite the bullish candle structure—a warning sign that the apparent strength lacks genuine support.
Consolidation Recognition
Extended periods of gray or dim candles indicate low conviction and indecision. These periods often represent consolidation ranges where neither buyers nor sellers have control. Such conditions may precede significant breakouts, making them useful for identifying potential setup zones.
Validating Areas Of Interest
Watch the candle colors and you will notice that in tight ranges, the candles will be darker and rarely have very bright colors, but once price reaches the edges of a range and has multiple bright colored candles, this validates that traders are now ready to move outside of that range and place directional trades. Use the bright colored candles to reveal where traders are interested in entering positions and use that conviction to your advantage.
-------------------------------------------------------------------
Settings Guide
Lower Timeframe - Sets the granularity for volume analysis. Lower timeframes like 1T provide more detailed data but may have limited historical depth on TradingView. Adjust based on your chart timeframe and data availability.
Price Action Influence % - Controls the blend between price action scoring and volume/order flow scoring. At 0%, the indicator uses pure order flow analysis. At 100%, it uses pure price action analysis. The default 50% provides equal weighting to both methods. Consider increasing toward 100% for instruments with unreliable volume data such as forex pairs or certain CFDs. For futures contracts with excellent volume reporting, values around 50% often work well.
Candle Color Settings - Customize the buy color (default bright green), sell color (default red), and base/neutral color (default gray) to match your chart theme and personal preferences.
Fix Loading Error - Toggle this checkbox if the indicator fails to load, displays incorrectly or starts lagging. This forces TradingView to restart the indicator and typically resolves any issues.
-------------------------------------------------------------------
Instrument and Timeframe Considerations
The order flow component requires reliable volume data for optimal results. Consider these guidelines:
Futures: Generally provide excellent volume data and work well with lower Price Action Influence settings
Stocks: Good volume data during regular trading hours
Forex: Volume reliability varies by exchange; test before relying heavily on volume scoring
Crypto: Volume reliability varies by exchange; test before relying heavily on volume scoring
Index CFDs: Often have poor volume data; higher Price Action Influence recommended
Higher timeframes (daily, weekly) typically produce more reliable color readings with less noise. Lower timeframes can be useful for timing entries within the context of higher timeframe analysis.
The indicator requires a brief initialization period—approximately 60 bars for full accuracy as the adaptive calculations populate their historical reference data.
-------------------------------------------------------------------
Practical Guidance
Order Flow Candles works effectively when combined with other analysis methods. Consider using it alongside support/resistance levels, where bright candles at key zones can confirm breakouts or bounces. Volume profile analysis pairs naturally with this indicator, as does traditional structure and trend analysis.
The indicator is designed as a visualization and decision-support tool. It helps quantify and display information that might otherwise require mentally processing multiple data points. However, profitable trading requires more than entry signals—risk management, position sizing, and broader market context remain essential components of any complete trading approach.
-------------------------------------------------------------------
Limitations
When using any amount of volume weighting, the candles will show as grey until it has had enough previous bars to establish baseline averages to use for calculations. When using tick data on higher than 1 minute charts, the number of chart bars you get data will be limited, so try adjusting the lower timeframe to use a higher timeframe for more data. Or you can switch to 100% price action influence to get price action only candle coloring for the entire data set
Volume analysis accuracy depends entirely on the quality of volume data available for your chosen instrument so make sure to look at charts with the most reliable volume data for best results
Lower timeframe data has limited historical depth on TradingView; older bars may have less accurate order flow readings
First bars of new trading sessions (gap bars) are scored conservatively and may appear dimmer than expected
During extremely fast market conditions, lower timeframe data may lag slightly
The indicator provides decision support but is not a complete trading system on its own, so use this indicator as a guide to make decisions, but do not rely solely on it

Elite Pip Academy - Price & Delta Divergence (Delta Pane)🎓 ELITE PIP ACADEMY - DELTA DIVERGENCE DETECTOR
This indicator displays cumulative delta volume in a separate pane and identifies divergences between price action and delta, providing the volume perspective of market divergences.
═══════════════════════════════════════════════════
📱 JOIN OUR FREE COMMUNITY:
🔸 Instagram: @elite_pip_academy
www.instagram.com
→ Trading education & market insights
→ Chart analysis examples
→ Educational content
→ Community highlights
🔸 Telegram Channel: FREE Market Analysis
→ Daily market analysis
→ Trading psychology lessons
→ Strategy discussions
→ Live Q&A sessions
→ Educational materials
👍 LIKE, FOLLOW & SHARE our Instagram to support free education!
═══════════════════════════════════════════════════
📊 WHAT IT DOES:
- Calculates and displays Normalized Cumulative Delta
- Detects divergences between price and volume
- Shows where buying/selling pressure conflicts with price movement
- Displays divergence lines directly on the delta chart
- Provides real-time delta status in information table
═══════════════════════════════════════════════════
📈 UNDERSTANDING CUMULATIVE DELTA:
Cumulative Delta measures the difference between buying and selling volume over time:
- Positive Delta (above zero line) = More buying pressure
- Negative Delta (below zero line) = More selling pressure
- Rising Delta = Increasing buying interest
- Falling Delta = Increasing selling interest
Want to learn more? Join our free Telegram for daily examples!
═══════════════════════════════════════════════════
🔍 DIVERGENCE TYPES:
🟢 BULLISH DIVERGENCE:
- Price: Lower Low ↓
- Delta: Higher Low ↑
- Interpretation: Despite price dropping, buying pressure is increasing
- Signal: Potential upward reversal
🔴 BEARISH DIVERGENCE:
- Price: Higher High ↑
- Delta: Lower High ↓
- Interpretation: Despite price rising, buying pressure is decreasing
- Signal: Potential downward reversal
═══════════════════════════════════════════════════
⚙️ KEY FEATURES:
✓ Real-time cumulative delta calculation
✓ Normalized delta for easier comparison
✓ Smooth delta line (adjustable smoothing period)
✓ Visual divergence lines on delta
✓ Customizable line styles (Solid, Dashed, Dotted)
✓ Adjustable line width (1-10)
✓ Color-coded background (green/red)
✓ Pivot point markers
✓ Information table showing current delta status
✓ Built-in alerts
✓ Elite Pip Academy branding with social media links
✓ Instagram & Telegram promotion in-chart
═══════════════════════════════════════════════════
🎯 HOW TO USE:
1. Add this indicator below your price chart (separate pane)
2. Add the companion "Elite Pip Academy - Price Divergence" to your main chart
3. Keep settings identical on both indicators
4. Watch the delta line for buying/selling pressure
5. Look for divergence lines and labels
6. Use the info table for quick delta status
7. Set up alerts for divergence notifications
8. Follow us on Instagram (@elite_pip_academy) for chart examples!
9. Join our Telegram for free daily market analysis!
═══════════════════════════════════════════════════
⚡ SETTINGS:
📊 Detection Settings:
- Pivot Lookback: Bars for pivot detection (default: 5)
- Delta Smoothing: SMA period for delta (default: 20)
👁️ Display Options:
- Toggle bullish/bearish divergences
- Show/hide labels and lines
📈 Delta Line Style:
- Delta line color customization
🟢 Bullish Divergence Style:
- Color selection
- Line width (1-10)
- Line style (Solid/Dashed/Dotted)
🔴 Bearish Divergence Style:
- Color selection
- Line width (1-10)
- Line style (Solid/Dashed/Dotted)
═══════════════════════════════════════════════════
📊 INFORMATION TABLE:
The top-right table displays:
- 🎓 Elite Pip Academy branding
- Delta Status (Positive/Negative)
- Current Delta Value
- Most Recent Signal (Bull/Bear/None)
- 📱 Instagram handle (@elite_pip_academy)
- 💬 Telegram link (Free Analysis)
═══════════════════════════════════════════════════
💡 TRADING APPLICATIONS:
✓ Identify potential reversals before they happen
✓ Confirm trend strength or weakness
✓ Spot accumulation/distribution phases
✓ Validate breakouts with volume confirmation
✓ Find divergences at key support/resistance
✓ Combine with order flow for institutional analysis
Join our Telegram to see real-world trading examples!
═══════════════════════════════════════════════════
🎓 EDUCATIONAL VALUE:
This tool helps you understand:
- How volume drives price movement
- The relationship between buying pressure and price
- When price and volume are in sync vs. diverging
- Market sentiment shifts before price reversals
- Professional volume analysis techniques
Follow our Instagram for bite-sized educational posts!
═══════════════════════════════════════════════════
📚 RECOMMENDED SETUP:
For complete divergence analysis, use BOTH indicators together:
1. **Elite Pip Academy - Price Divergence**
→ Shows divergence lines on price chart
2. **Elite Pip Academy - Delta Divergence** (this indicator)
→ Shows cumulative delta with divergence lines
This dual setup provides:
- Visual correlation between price and volume
- Immediate identification of divergences
- Complete picture of market dynamics
- Professional-grade analysis
═══════════════════════════════════════════════════
🔧 TECHNICAL NOTES:
- Delta Calculation: Uses tick-level volume approximation
- Best Results: Liquid markets with good volume data
- Timeframes: Works on all, but most effective on intraday charts
- Normalization: Delta is normalized against its SMA for clarity
- Pivot Detection: Uses standard TradingView pivot functions
═══════════════════════════════════════════════════
📱 FREE EDUCATIONAL RESOURCES:
🔸 Instagram (@elite_pip_academy):
✓ Daily trading education
✓ Live chart examples
✓ Strategy breakdowns
✓ Market psychology
✓ Community Q&A
Link: www.instagram.com
🔸 Telegram Channel:
✓ Free daily market analysis
✓ Trading psychology lessons
✓ Real-time chart reviews
✓ Strategy discussions
✓ Educational webinars
✓ Support community
👍 LIKE & SHARE our content to help others learn!
═══════════════════════════════════════════════════
⚠️ CRITICAL DISCLAIMER:
**THIS INDICATOR IS FOR EDUCATIONAL PURPOSES ONLY**
❌ This is NOT:
- Financial advice
- Investment advice
- Trading signals
- A guarantee of profits
- A substitute for professional advice
✅ This IS:
- An educational tool
- A learning resource
- A volume analysis helper
- A divergence detection aid
═══════════════════════════════════════════════════
⚠️ RISK WARNING:
Trading and investing carry substantial risk of loss. You can lose some or all of your capital. Key risks include:
- Market risk
- Volatility risk
- Liquidity risk
- Leverage risk (if using margin)
- Execution risk
- Technology/platform risk
Past performance does not indicate future results. Divergences do not guarantee reversals. Markets can remain irrational longer than you can remain solvent.
═══════════════════════════════════════════════════
📋 BEFORE YOU TRADE:
✓ Understand the indicator completely
✓ Practice on demo accounts extensively
✓ Test on historical data
✓ Develop a complete trading plan
✓ Use proper risk management (stop losses, position sizing)
✓ Never risk more than you can afford to lose
✓ Consult qualified financial advisors
✓ Comply with your local regulations
✓ Keep a trading journal
✓ Continue your education (join our Telegram!)
═══════════════════════════════════════════════════
🎓 ABOUT ELITE PIP ACADEMY:
Elite Pip Academy is committed to providing high-quality educational tools and resources for traders worldwide. Our mission is to help you understand market mechanics, develop analytical skills, and make informed trading decisions.
We believe in:
- Quality education over quick profits
- Understanding over memorization
- Practice over theory alone
- Continuous improvement
- Responsible trading
- Community support
Join our growing community on Instagram and Telegram!
═══════════════════════════════════════════════════
💼 LIABILITY DISCLAIMER:
By using this indicator, you acknowledge that:
- You are using it at your own risk
- Elite Pip Academy is not liable for any losses
- You are solely responsible for your trading decisions
- You have read and understood all disclaimers
- You will not hold the creators liable for any outcomes
- You understand that trading results vary by individual
- You are of legal age to trade in your jurisdiction
- You comply with all applicable laws and regulations
═══════════════════════════════════════════════════
📱 STAY CONNECTED:
Instagram: @elite_pip_academy
🔗 www.instagram.com
Telegram: Elite Pip Academy (Free Channel)
💬 Free market analysis & trading psychology
📧 Support & Feedback: Contact us through Instagram DM
═══════════════════════════════════════════════════
🌟 SUPPORT OUR MISSION:
If you find this tool helpful:
👍 Like our Instagram posts
📤 Share with fellow traders
💬 Join our Telegram community
⭐ Leave a review on TradingView
📸 Tag us in your chart screenshots
Your support helps us create more FREE educational content!
═══════════════════════════════════════════════════
✅ INDICATOR INFORMATION:
- Version: 1.0
- Release Date: February 2026
- Language: Pine Script v5
- Compatibility: All TradingView plans
- Markets: All (stocks, forex, crypto, futures, etc.)
- Timeframes: All (best on intraday)
- Dependencies: None (standalone)
- Updates: Follow Instagram for announcements
═══════════════════════════════════════════════════
🔖 TAGS:
cumulative delta, divergence, volume analysis, delta volume, order flow, price action, volume profile, market structure, educational tool, trading education, technical analysis, volume indicators, reversal detection, buying pressure, selling pressure, elite pip academy, instagram trading, telegram trading, free market analysis, trading community
═══════════════════════════════════════════════════
Thank you for choosing Elite Pip Academy for your trading education!
📱 Follow @elite_pip_academy on Instagram
💬 Join our FREE Telegram for daily analysis
Remember: Knowledge + Practice + Discipline + Community = Success
Happy Learning! 📚📈

Auction Market Theory LevelsAuction Market Theory Indicator
TradingView Pine Script v6 indicator that plots Auction Market Theory (AMT) session levels for RTH/ETH, including value area, VPOC, initial balance extensions, and session VWAP, with Bookmap cloud notes logging.
Features
RTH and ETH session detection with configurable session times.
RTH levels: HOD/LOD, IB30, IB60, IB0.5, IB1.5, IB2.
Value Area (VAH/VAL) and VPOC computed from a session volume profile histogram.
ETH levels: ONH/ONL/ONMID/ONVPOC.
Session VWAP overlay.
Optional labels and/or lines, with ability to extend lines to the right.
Previous session level carry-forward.
Bookmap CSV-style logging and alert payload formatting.
## Inputs
Sessions: `RTH session time`, `ETH session time`.
Levels toggles: `Show HOD and LOD`, `Show IB`, `Show IB30`, `Show IB60`, `Show IB1.5`, `Show IB2`, `Show ONH, ONL, ONVPOC, ONMID`, `Show VAH and VAL`, `Show VPOC`.
Value Area: `Value Area %`, `Number of Histograms`.
Display: `Show price labels`, `Show Lines at price levels`, `Extend lines to the right`, `Session VWAP`, `VWAP color`.
Lookback: `Look back time in hours for previous sessions`.
Logging: `Symbol Prefix` for Bookmap datafeed output.
Getting started
1. Open TradingView and create a new Pine Script.
2. Paste the contents of (src/auction-market-theory.pine).
3. Save and add the indicator to a chart.
Notes
The indicator is designed to run on intraday timeframes with session boundaries.
VPOC/VAH/VAL are calculated from a volume profile histogram built from session bars.
Alerts emit a CSV-style payload containing AMT levels for Bookmap.
Bookmap Cloud Notes output
The script logs and alerts a CSV-style line compatible with Bookmap Cloud Notes. Each line follows this format:
"SYMBOL",PRICE,NOTE,FG_COLOR,BG_COLOR,ALIGN,DIAMETER,LINE
Example (from the script):
"ESH6.CME@BMD",5243.25,ONVPOC,#000000,#ff0066,left,1,TRUE
Alerts → email → local Bookmap Cloud Notes
TradingView alerts can be configured to send these CSV lines to your email address. A simple Python script can then read the email and publish the notes locally to Bookmap Cloud Notes.
Suggested flow:
1. Create a TradingView alert for this indicator.
2. Use the alert message template to output the payload (the script already builds the message in `msg`).
3. Configure the alert to send to your email.
4. Run a local Python reader that parses the incoming email and forwards the CSV lines to your Bookmap Cloud Notes endpoint.

RokTrades Info Table PRORokTrades Info Table PRO
This is my “at-a-glance” market context HUD that lives on your chart. The goal is simple: stop guessing and get a clean read on what the internals + volatility are actually doing while you’re trading.
Instead of bouncing between tickers and dashboards, this table keeps the important stuff in one place:
- Volatility pressure / tailwind (VIX + optional VXN)
- Breadth / participation (NYSE + NASD U/D, ADD, optional TRIN + TICK)
- Put/Call positioning (P/C with a trend filter)
- A fast “what kind of day is this?” read so you’re not forcing trend trades on chop days (or fading a real trend)
It’s built to be fast, readable, and usable intraday — with an Expanded mode (more explanation in the hint column) and a Compact mode (clean, minimal, mobile-friendly). You can also choose your internals timeframe, table position, and text size so it fits your layout.
How I use it (real quick)
I’m basically checking three things:
1) Are internals supporting the move or fighting it?
2) Is the open move legit or likely to trap?
3) Where are the key levels that matter right now?
When the table is screaming “risk-off / weak breadth / VIX rising” while price is pushing higher, that’s usually a “be careful” moment. When everything aligns, I’m way more willing to press trades and hold winners.
What PRO adds vs the LITE version
The LITE version is a solid “quick glance” table — regimes, basic internals, and key level states (above/below).
PRO is the full trading workflow. Here’s what you get in PRO that you don’t get in LITE:
1) VIX-Weighted Internals Scoring (INT SCORE)
PRO builds a real score from:
- VIX regime (VIX vs its EMA)
- VIX momentum + extension
- Breadth signals (U/D, ADD, optional TRIN/TICK)
- Optional Put/Call input (regime or direction)
So you’re not eyeballing 6 signals and trying to “feel” the bias — you get a number and a background color that shows trend/chop/bias instantly.
2) OPEN SCORE + OPEN TYPE (Since Open)
This is huge. PRO tracks the since-open deltas and gives you:
- OPEN SCORE (what internals have done since the open)
- OPEN TYPE (open trend / open chop / open bull / open bear)
This helps you avoid the classic trap where the day turns into something totally different after the first push.
3) Score Alignment (OPEN vs INT)
PRO compares:
- what the open is doing
vs
- what the overall internals bias is doing
If they’re aligned, you can trust continuation more. If they diverge, you should tighten up, expect whips, and demand confirmation.
4) ORB (15m / 30m / 60m) with live state
PRO builds accurate ORB levels using 1-minute data and shows:
- Building progress early (B 7/15 etc.)
- State once complete: ABV / IN / BLW
- ORH/ORL values in the hint column
5) Trap Warning System (Severity + Play Hint)
This is one of my favorite parts:
- It watches for breakouts above ORH / below ORL that are not supported by internals
- Gives a Trap Type (Bull / Bear / Divergence / Chop)
- Gives Severity (LOW / MED / HIGH)
- Optional Play Hint (WAIT / FADE / BUY style guidance)
It’s not “signals.” It’s a warning system to keep you from getting smoked by fake moves.
6) More Key Levels + Better Session Logic
LITE has PMH/PML + PDH/PDL/YClose/Mid (table states).
PRO adds:
- Overnight High / Low (ONH/ONL) based on a real overnight session (16:00–09:30)
- RTH Open (RTHO)
- Prev-day levels with a choice of RTH mode vs Full Day mode
- Better “anchor time” handling so levels are based on the session they belong to
7) Prev-Day Volume Profile (Approx) — YPOC / VAH / VAL
PRO computes an approximate previous day RTH volume profile using 1-minute data and gives you:
- YPOC
- YVAH / YVAL
- Plus a safety flag if it overflows (so you know when to adjust bin size / max bins)
8) Plot Engine (Lines + Labels) — One clean UI for everything
LITE is table-only.
PRO can plot the levels on your chart with a consistent, clean UI:
- Extend right or full chart
- Solid / dashed / dotted
- Width control
- Optional labels with side/size/offset and price included
And it’s all toggle-based so you can keep it clean and only plot what you care about.
9) Extra Day Context: Inside/Outside, Gap %, Range vs ADR%
PRO includes:
- Inside / Outside / Expansion day type
- Gap %
- Range vs ADR%
So you’re not trading blind into a day that’s already exhausted its typical range.
Notes / Tips
- Premarket levels require extended hours candles to be enabled.
- Internals feeds can vary by broker/data package — if something shows NA, it’s usually a data permission issue.
- This tool is designed to be a context + decision support HUD, not a “buy/sell signal generator.”

Crypto MMFCrypto MMF Indicator:
The Crypto Money Flow (MMF) indicator represents an advanced technical analysis tool specifically designed for cryptocurrency markets. This document outlines the logical foundation for its component integration, explains the synergistic mechanisms between its constituent elements, and provides practical implementation guidance without making unrealistic performance claims.
Integration Rationale
Volume-Weighted Momentum Analysis
The primary integration rationale combines price momentum with trading volume—two fundamental market dimensions frequently analyzed in isolation. Traditional momentum oscillators like RSI measure price velocity but ignore transaction volume, potentially misrepresenting conviction behind price movements. By multiplying price changes by corresponding volume, the indicator creates a conviction-weighted momentum measure that distinguishes between high-volume breakouts and low-volume price fluctuations.
The theoretical foundation for this integration stems from market microstructure theory, which posits that volume accompanies informed trading. In cryptocurrency markets—where volatility is pronounced and manipulation attempts occur—volume confirmation provides valuable filtering of meaningful price movements from noise.
Multi-Timeframe Momentum Convergence
The second integration layer incorporates higher timeframe analysis, acknowledging that markets function across temporal hierarchies. While shorter timeframes offer precision for entry and exit timing, longer timeframes establish directional bias and filter out insignificant counter-trend movements. This multi-timeframe approach follows established technical analysis principles that prioritize trend alignment across time horizons.
This integration is particularly relevant for cryptocurrency traders, as these markets exhibit strong momentum characteristics where higher timeframe trends often dominate shorter-term fluctuations. The higher timeframe component serves as both a trend filter and early warning system for momentum divergences.
Component Synergy Mechanism
Core Calculation Components
Price-Volume Integration Engine
The indicator begins by calculating the average of open, high, low, and close prices (OHLC4), providing a balanced price representation less susceptible to intra-period anomalies. This value undergoes differencing to establish direction, then multiplies by volume to create volume-weighted momentum values. This transformation produces two separate data streams: upward volume-weighted momentum and downward volume-weighted momentum.
Exponential Smoothing Application
Both momentum streams undergo exponential smoothing using Wilder's Relative Moving Average methodology. This approach applies greater weight to recent observations while maintaining memory of historical patterns, striking an optimal balance between responsiveness and noise reduction. The smoothed upward and downward momentum values create a ratio representing the relative strength between buying and selling pressure.
Normalization Process
The momentum ratio undergoes mathematical normalization to produce a bounded oscillator ranging from 0 to 100. This normalization enables consistent interpretation across different market conditions, timeframes, and cryptocurrency pairs, establishing standardized overbought and oversold thresholds.
Multi-Timeframe Synchronization System
Hierarchical Timeframe Calculation
The indicator dynamically determines appropriate higher timeframes based on user-defined multipliers and current chart intervals. This automated calculation eliminates manual timeframe selection errors while ensuring logical temporal relationships between analyzed periods.
Cross-Timeframe Data Retrieval
A secure data retrieval mechanism accesses higher timeframe momentum calculations without introducing future bias or repainting. This process maintains data integrity while enabling direct comparison between current and higher timeframe momentum conditions.
Higher Timeframe Smoothing Layer
An additional exponential moving average smooths the higher timeframe data, reducing noise and creating a stable reference signal for divergence analysis. This smoothing parameter is independently adjustable, allowing users to balance sensitivity and stability according to their trading style.
Signal Generation Framework
Threshold-Based Zone Analysis
The indicator establishes three operational zones based on statistical observations of momentum extremes:
Neutral zone (25-75): Represents balanced market conditions
Lower extreme zone (0-25): Indicates potential oversold conditions
Upper extreme zone (75-100): Indicates potential overbought conditions
These threshold levels derive from empirical observations of momentum oscillator behavior in trending and ranging cryptocurrency markets, though optimal values may vary across different market regimes.
Conditional Signal Categorization
The system monitors four distinct momentum conditions:
Initial extreme readings: Momentum enters extreme zones without confirmation
Confirmed extremes: Smoothed momentum follows into extreme zones
Multi-timeframe alignment: Current and higher timeframe momentum move in concert
Multi-timeframe divergence: Current and higher timeframe momentum diverge
Each condition category carries different interpretive implications, with stronger signals emerging when multiple conditions converge.
Practical Implementation Guidelines
Functional Applications
Trend Confirmation Protocol
When price trends directionally with momentum maintaining consistent readings above or below the midpoint (50), and higher timeframe momentum confirms the direction, this suggests sustainable trend conditions. The volume-weighting component further validates whether significant trading activity supports the price movement.
Divergence Detection Methodology
Three divergence types merit monitoring:
Classic divergence: Price reaches new extremes while momentum fails to confirm
Hidden divergence: Price retraces within a trend while momentum suggests trend continuation
Timeframe divergence: Momentum moves opposite directions across timeframes
Divergence analysis proves most reliable when occurring in conjunction with other technical factors such as support/resistance levels or chart patterns.
Zone-Based Risk Assessment
The oscillator's bounded nature facilitates structured risk assessment:
Extreme zone entries: Higher potential reward but require confirmation
Neutral zone movements: Lower signal clarity but potentially favorable risk-reward ratios
Zone transitions: Often precede accelerated price movements
Parameter Configuration Philosophy
Core Parameter Settings
The default parameters balance responsiveness and reliability across diverse cryptocurrency market conditions. The 14-period calculation length aligns with conventional momentum oscillator standards, providing sufficient data for meaningful smoothing while maintaining sensitivity to recent market developments.
Multi-Timeframe Multiplier Selection
The default 3x multiplier creates meaningful temporal separation without introducing excessive lag. This multiplier proves particularly effective for swing trading horizons, though position traders may benefit from larger multipliers while shorter-term traders might reduce this value.
Smoothing Parameter Considerations
Dual smoothing parameters (primary and higher timeframe) allow independent adjustment of sensitivity. More volatile cryptocurrency pairs typically benefit from increased smoothing, while less volatile conditions may permit reduced smoothing for earlier signal generation.
Interpretation Protocol
Step 1: Momentum Context Assessment
Begin analysis by determining the current momentum context:
Absolute level relative to threshold zones
Direction and velocity of recent momentum changes
Relationship to the midpoint (50) level
Step 2: Timeframe Alignment Evaluation
Compare current and higher timeframe momentum:
Confirm directional alignment for trend trading
Identify divergences for potential reversal scenarios
Assess convergence strength for position sizing decisions
Step 3: Volume Confirmation Analysis
Evaluate whether recent volume patterns support momentum readings:
Extreme momentum with declining volume: Caution warranted
Neutral momentum with increasing volume: Potential breakout precursor
Confirmed momentum with expanding volume: Higher conviction signal
Step 4: Market Context Integration
Correlate momentum readings with broader market context:
Correlated cryptocurrency movements
Overall market capitalization trends
Relevant news or fundamental developments
Originality and Differentiation
Innovative Design Elements
Volume-Integrated Momentum Calculation
Unlike conventional momentum oscillators that analyze price in isolation, this indicator integrates volume as a conviction multiplier. This integration follows logical market principles where volume validates price movements, creating a more robust momentum assessment particularly valuable in cryptocurrency markets where volume manipulation attempts occasionally occur.
Dynamic Timeframe Adaptation
The automated timeframe calculation system eliminates manual timeframe selection while ensuring logical temporal relationships. This approach reduces user error and maintains consistency across different charting intervals and trading instruments.
Multi-Layer Confirmation Framework
The indicator employs three analytical layers: raw momentum, smoothed momentum, and higher timeframe momentum. This layered approach provides graduated confirmation levels, allowing traders to distinguish between preliminary signals and confirmed conditions.
Theoretical Foundations
The indicator's design incorporates elements from multiple technical analysis disciplines:
Momentum analysis principles from oscillator theory
Volume-price relationships from market microstructure
Multi-timeframe analysis from hierarchical trend theory
Statistical normalization from quantitative analysis
This interdisciplinary approach creates a comprehensive tool addressing multiple dimensions of market analysis rather than focusing on isolated phenomena.
Risk Management Integration
Signal Quality Assessment
The indicator facilitates signal quality evaluation through multiple confirmation requirements:
Primary momentum extreme reading
Smoothed momentum confirmation
Higher timeframe alignment or constructive divergence
Supporting volume characteristics
Signal strength varies with the number of confirmed elements, enabling proportionate position sizing and risk allocation.
False Signal Mitigation
Several design elements reduce false signal susceptibility:
Volume-weighting filters low-conviction price movements
Exponential smoothing reduces noise-induced fluctuations
Multi-timeframe analysis filters counter-trend movements
Graduated confirmation requirements prevent premature action
These mechanisms collectively improve signal reliability while acknowledging that no technical indicator eliminates false signals entirely.
Implementation Considerations
Cryptocurrency Market Specificity
The indicator incorporates design elements particularly relevant to cryptocurrency markets:
24/7 market operation accommodation
High volatility regime compatibility
Volume data availability considerations
Cross-market correlation awareness
These adaptations enhance effectiveness in cryptocurrency trading environments while maintaining applicability to traditional financial markets.
Customization Guidelines
Users may adjust parameters based on:
Trading timeframe (scalping, day trading, swing trading)
Cryptocurrency pair characteristics (volatility, volume profile)
Risk tolerance and trading style
Market regime (trending, ranging, transitional)
Empirical testing across different parameter sets and market conditions provides the most reliable customization guidance.
Conclusion
The Crypto MMF indicator represents a logically integrated analytical tool combining volume-weighted momentum analysis with multi-timeframe perspective. Its component synergy creates a comprehensive market assessment framework while maintaining practical implementation feasibility. Users should integrate this tool within broader trading methodologies, combining its signals with additional technical, fundamental, and risk management considerations.
The indicator's value derives from its structured approach to market analysis rather than predictive capabilities. By providing organized information about momentum, volume relationships, and timeframe interactions, it supports informed trading decisions within appropriate risk parameters.

Market State Engine V2# Market State Engine
**Deterministic Confidence-Scoring System for TradingView**
A professional-grade PineScript v5 indicator that scores market conditions from 0-100, helping traders identify high-quality trading opportunities through systematic structure analysis, VWAP positioning, order flow dynamics, and time-based context.
---
## 🎯 Overview
The **Market State Engine** is not a trading bot—it's a **noise-reduction and opportunity-ranking system** designed to filter market conditions and surface only the highest-quality setups.
Instead of blindly taking every signal, this indicator:
- ✅ **Scores** market conditions objectively (0-100 scale)
- ✅ **Filters** out low-probability setups automatically
- ✅ **Classifies** opportunities into A, A+, and A++ grades
- ✅ **Alerts** only on confirmed structure shifts with supporting context
- ✅ **Keeps the human in control** - provides intelligence, not automation
### Philosophy: Reduce Noise. Enforce Discipline. Surface Quality.
---
## 🚀 Key Features
- **Deterministic Scoring** - No black boxes, fully explainable logic
- **Multi-Factor Analysis** - Combines 4 independent market state components
- **Structure-First Approach** - Only alerts on confirmed pivot breaks
- **VWAP Mean Reversion Logic** - Directional filtering based on VWAP zones
- **Order Flow Proxy** - CVD divergence and confirmation detection
- **Session-Aware Scoring** - Prioritizes high-volume New York sessions
- **Alert De-Duplication** - One alert per unique structure shift
- **Zero Repainting** - Uses confirmed pivots only (left=2, right=2)
- **Fully Configurable** - All parameters exposed as inputs
- **Visual Feedback** - VWAP bands, setup labels, and real-time score panel
---
## 📊 Scoring System (0-100)
The Market State Engine evaluates **four independent components**, each contributing up to **25 points** for a maximum total score of **100**.
### 🎯 Component Breakdown
| Component | Max Points | Description |
|-----------|------------|-------------|
| **VWAP Context** | 25 | Measures price deviation from session VWAP |
| **Structure Shift** | 25 | Confirms pivot breakout (HARD GATE) |
| **CVD Alignment** | 25 | Detects order flow divergence/confirmation |
| **Time-of-Day** | 25 | Identifies high-probability trading sessions |
---
### 1️⃣ VWAP Context (Max 25 Points)
**Purpose:** Identifies extreme price deviations from fair value for mean-reversion opportunities.
VWAP (Volume-Weighted Average Price) is calculated session-anchored to New York market time, with standard deviation bands creating zones of opportunity.
#### Band Structure:
- **1st Band**: ±1σ from VWAP (fair value zone)
- **2nd Band**: ±2σ from VWAP (moderate deviation)
- **3rd Band**: ±3σ from VWAP (extreme deviation)
#### Scoring Logic (Exclusive):
```
Price in 3rd VWAP Band (>2σ and ≤3σ) → +25 points
Price in 2nd VWAP Band (>1σ and ≤2σ) → +15 points
Otherwise (inside 1σ or beyond 3σ) → 0 points
```
**Key Insight:** The further price stretches from VWAP, the higher the probability of mean reversion.
---
### 2️⃣ Structure Shift (Max 25 Points) — **HARD GATE**
**Purpose:** Confirms momentum shift through confirmed pivot breakouts.
⚠️ **CRITICAL:** Structure shift is **mandatory**. If no valid structure shift occurs, the **total score becomes 0** regardless of other factors.
#### Detection Method:
Uses TradingView's `ta.pivothigh()` and `ta.pivotlow()` functions with **locked parameters**:
- **Left bars**: 2
- **Right bars**: 2
- **Source**: Configurable (Wick or Body)
- **Break confirmation**: Candle close only
#### Bullish Structure Shift:
- ✅ Prior swing high exists (confirmed pivot)
- ✅ Current candle **closes above** swing high + tick buffer
- ✅ Must occur in VWAP 2nd or 3rd band
- ✅ **VWAP Filter**: Price must be **at or below VWAP** (lower bands)
#### Bearish Structure Shift:
- ✅ Prior swing low exists (confirmed pivot)
- ✅ Current candle **closes below** swing low - tick buffer
- ✅ Must occur in VWAP 2nd or 3rd band
- ✅ **VWAP Filter**: Price must be **at or above VWAP** (upper bands)
#### Scoring:
```
Valid structure shift → +25 points
No structure shift → Total score = 0
```
**Tick Buffer:** Default 5 ticks (configurable) - prevents false breaks from minor price noise.
---
### 3️⃣ CVD Alignment (Max 25 Points)
**Purpose:** Detects institutional order flow through volume delta analysis.
CVD (Cumulative Volume Delta) is a proxy for order flow:
```
Close > Open → +Volume (buying pressure)
Close < Open → -Volume (selling pressure)
```
#### Scoring Logic:
| Condition | Points | Description |
|-----------|--------|-------------|
| **Divergence** | +25 | Price makes higher high + CVD makes lower high (bearish)Price makes lower low + CVD makes higher low (bullish) |
| **Confirmation** | +20 | Price and CVD both make higher highs or lower lows |
| **Neutral** | 0 | No clear divergence or confirmation |
**Lookback Window:** Last 20 bars (configurable) - prevents stale divergences.
**Key Insight:** Divergences suggest weakening momentum, while confirmations validate the trend.
---
### 4️⃣ Time-of-Day Context (Max 25 Points)
**Purpose:** Prioritizes high-volume, high-volatility New York sessions.
#### Scored Sessions (America/New_York timezone):
| Session | Time Range (NY) | Points | Description |
|---------|-----------------|--------|-------------|
| **Pre-Market** | 03:00 - 04:00 | +25 | Early liquidity injection |
| **Market Open** | 09:30 - 11:30 | +25 | Highest volume period |
| **Off-Hours** | All other times | 0 | Lower probability setups |
**Key Insight:** Structure shifts during active sessions have higher follow-through probability.
---
## 🏆 Setup Classification
Setups are graded based on total score thresholds (configurable):
| Grade | Score Range | Typical Components | Quality Level |
|-------|-------------|-------------------|---------------|
| **A++ Setup** | ≥90 | All 4 factors aligned(VWAP 3rd band + Structure + CVD + Session) | Premium - Rare |
| **A+ Setup** | ≥75 | Structure + VWAP + CVD or Session(3 of 4 factors) | High - Select |
| **A Setup** | ≥60 | Structure + VWAP + Session(Minimum viable setup) | Good - Regular |
| **No Grade** | <60 | Insufficient confluence | Filtered out |
**Default Thresholds:**
- A Setup: 60 points
- A+ Setup: 75 points
- A++ Setup: 90 points
---
## 📥 Installation
### Step 1: Download the Indicator
Download the `market_state_engine.pine` file from this repository.
### Step 2: Add to TradingView
1. Open (www.tradingview.com)
2. Open the **Pine Editor** (bottom panel)
3. Click **"New"** → **"Blank indicator"**
4. Delete all default code
5. Paste the contents of `market_state_engine.pine`
6. Click **"Add to Chart"**
### Step 3: Configure for Your Symbol
1. Click the **gear icon** next to the indicator name
2. Adjust **Tick Size** for your instrument:
- ES futures: `0.25`
- NQ futures: `0.25`
- Stocks: `0.01`
3. Save settings
---
## ⚙️ Configuration
### Symbol Settings
| Parameter | Default | Description |
|-----------|---------|-------------|
| **Tick Size** | 0.25 | Minimum price movement for your symbol |
| **Tick Buffer Count** | 5 | Ticks beyond swing for valid break |
### VWAP Settings
| Parameter | Default | Description |
|-----------|---------|-------------|
| **VWAP Band 1 (σ)** | 1.0 | 1st standard deviation multiplier |
| **VWAP Band 2 (σ)** | 2.0 | 2nd standard deviation multiplier |
| **VWAP Band 3 (σ)** | 3.0 | 3rd standard deviation multiplier |
### Session Settings
| Parameter | Default | Description |
|-----------|---------|-------------|
| **Session 1** | 0300-0400 | Pre-market window (NY time) |
| **Session 2** | 0930-1130 | Market open window (NY time) |
### Score Thresholds
| Parameter | Default | Description |
|-----------|---------|-------------|
| **A Setup Threshold** | 60 | Minimum score for A grade |
| **A+ Setup Threshold** | 75 | Minimum score for A+ grade |
| **A++ Setup Threshold** | 90 | Minimum score for A++ grade |
### CVD Settings
| Parameter | Default | Description |
|-----------|---------|-------------|
| **CVD Divergence Lookback** | 20 | Maximum bars for divergence detection |
### Swing Settings
| Parameter | Default | Options | Description |
|-----------|---------|---------|-------------|
| **Swing Detection Method** | Wick | Wick / Body | Use high/low or open/close for pivots |
### Visual Settings
| Parameter | Default | Description |
|-----------|---------|-------------|
| **Show VWAP Bands** | ✅ | Display VWAP and standard deviation bands |
| **Show Setup Labels** | ✅ | Display setup markers on chart |
| **Show Score Panel** | ✅ | Display real-time score breakdown |
---
## 📖 How to Use
### Step 1: Apply to 1-Minute Chart
⚠️ **The indicator is locked to 1-minute timeframe** - do not use on other timeframes.
### Step 2: Understand the Visual Signals
#### Setup Labels
- **Green Triangle (▲)** - Bullish (Long) setup detected
- **Red Triangle (▼)** - Bearish (Short) setup detected
- Label shows **Grade** (A/A+/A++) and **Total Score**
#### VWAP Bands
- **Yellow Line** - Session VWAP (fair value)
- **Blue Bands** - ±1σ (fair value zone)
- **Purple Bands** - ±2σ (moderate deviation)
- **Red Bands** - ±3σ (extreme deviation)
#### Score Panel (Top Right)
Real-time breakdown of all four components:
```
Component Score
VWAP Zone 15/25
Structure 25/25
CVD 20/25
Session 25/25
TOTAL 85/100 (A+)
```
### Step 3: Interpret Signals
#### Valid Long Setup:
✅ Green triangle below candle
✅ Price in **lower VWAP bands** (below VWAP)
✅ Structure shift breaks swing high
✅ Score ≥60
#### Valid Short Setup:
✅ Red triangle above candle
✅ Price in **upper VWAP bands** (above VWAP)
✅ Structure shift breaks swing low
✅ Score ≥60
### Step 4: Set Up Alerts (See Alert Conditions section)
---
## 🚦 Signal Filters (VWAP Zone Logic)
The indicator uses **directional VWAP filtering** to prevent counter-trend signals:
### Long Signals (Green)
**Only allowed when price is AT or BELOW VWAP**
- ✅ Lower 2nd band (-2σ to -1σ)
- ✅ Lower 3rd band (-3σ to -2σ)
- ✅ At VWAP exactly
- ❌ **BLOCKED** in upper bands (above VWAP)
**Logic:** Longs when price is stretched below fair value (mean reversion)
### Short Signals (Red)
**Only allowed when price is AT or ABOVE VWAP**
- ✅ Upper 2nd band (+1σ to +2σ)
- ✅ Upper 3rd band (+2σ to +3σ)
- ✅ At VWAP exactly
- ❌ **BLOCKED** in lower bands (below VWAP)
**Logic:** Shorts when price is stretched above fair value (mean reversion)
---
## 🎨 Visual Elements
### Chart Overlays
| Element | Color | Description |
|---------|-------|-------------|
| **VWAP Line** | Yellow | Session-anchored fair value |
| **±1σ Bands** | Blue | Fair value zone (no score) |
| **±2σ Bands** | Purple | Moderate deviation (15 pts) |
| **±3σ Bands** | Red | Extreme deviation (25 pts) |
| **Swing Highs** | Red ▼ | Confirmed pivot highs |
| **Swing Lows** | Green ▲ | Confirmed pivot lows |
| **Session Background** | Light Green | Active high-value session |
### Setup Labels
**Bullish Setup:**
```
A+
▲ 75
```
Green label below candle, shows grade and score
**Bearish Setup:**
```
A++
▼ 90
```
Red label above candle, shows grade and score
### Score Panel
Real-time table in top-right corner:
- Individual component scores (0-25 each)
- Total score (0-100)
- Current setup grade (A/A+/A++)
- Updates in real-time as market conditions change
---
## 🔔 Alert Conditions
### Setting Up Alerts
#### Method 1: Built-in Alert Conditions
1. Click **"Create Alert"** in TradingView
2. Select **Market State Engine** as condition
3. Choose alert type:
- **Bullish Setup** - Long signals only
- **Bearish Setup** - Short signals only
- **Any Setup** - All signals
4. Set to **"Once Per Bar Close"**
5. Configure notification method (app, email, webhook)
#### Method 2: Custom Alert Message
Alert messages include full breakdown:
```
A+ Setup Detected (Score: 85)
Components: VWAP(25) + Structure(25) + CVD(20) + Time(15)
CVD State: Confirmation
Direction: Long
Timeframe: 1m
```
### Alert Behavior
✅ **One alert per unique pivot break** - no spam
✅ **Fires on candle close only** - no repainting
✅ **Minimum score filter** - only A grade or higher (≥60)
✅ **Direction-specific** - separate bullish/bearish conditions
⚠️ **No cooldown between different pivots** - multiple alerts per session allowed if different swing levels break
---
## 🔧 Technical Details
### Timeframe Lock
- **Required**: 1-minute chart only
- **Reason**: Scoring model calibrated for 1m micro-structure
- **Future**: Multi-timeframe support planned for v2
### Timezone Configuration
- **Hard-coded**: `America/New_York`
- **Session Detection**: Uses TradingView's native session functions
- **Consistency**: All time-based logic uses NY timezone
### Swing Detection Parameters
**Locked to specification:**
- `ta.pivothigh(source, left=2, right=2)`
- `ta.pivotlow(source, left=2, right=2)`
**Implications:**
- Pivots confirmed 2 bars after formation
- No repainting - historical pivots don't move
- 4-bar minimum swing structure (2 left + pivot + 2 right)
### VWAP Calculation
- **Type**: Session-anchored (resets daily)
- **Source**: Typical price `(high + low + close) / 3`
- **Weighting**: Volume-weighted
- **Standard Deviation**: True population standard deviation
### CVD Proxy Formula
```pine
barDelta = close > open ? volume : close < open ? -volume : 0
CVD = cumulative sum of barDelta (session-reset)
```
### Performance Limits
- **Max Labels**: 500 (TradingView limit)
- **Max Bars Back**: 500
- **Memory**: Lightweight - uses only essential variables
---
## 💡 Best Practices
### 1. **Use as a Filter, Not a Strategy**
❌ Don't: Blindly take every signal
✅ Do: Use score as confluence for your existing analysis
### 2. **Higher Grades = Better Probability**
- **A Setups (60-74)**: Regular opportunities, still require discretion
- **A+ Setups (75-89)**: High-quality, multiple factors aligned
- **A++ Setups (90-100)**: Rare premium opportunities, strongest edge
### 3. **Respect the VWAP Zone Filter**
The indicator **automatically blocks**:
- Longs in upper VWAP bands (counter-trend)
- Shorts in lower VWAP bands (counter-trend)
Trust this logic - it enforces mean reversion discipline.
### 4. **Monitor the Score Panel**
Watch which components are scoring to understand **why** a setup formed:
- Missing CVD score? → No order flow confirmation
- Missing Time score? → Outside high-volume sessions
- Low VWAP score? → Weak deviation from fair value
### 5. **Combine with Risk Management**
The indicator provides **opportunity scoring**, not position sizing:
- Use stop losses based on swing structure
- Scale position size with setup grade (larger on A++, smaller on A)
- Set profit targets at VWAP or opposing band
### 6. **Session Awareness**
Prioritize signals during **active sessions**:
- **03:00-04:00 NY**: Pre-market momentum
- **09:30-11:30 NY**: Highest volume, tightest spreads
Off-hours signals (0 time score) are lower probability but still valid if other factors strong.
### 7. **Understand the Hard Gate**
If **no structure shift** occurs:
- Total score = 0
- No alerts fire
- Other components irrelevant
**Why?** Structure shift confirms momentum change - without it, there's no tradable opportunity.
### 8. **Avoid Over-Optimization**
Default settings are well-calibrated:
- Don't chase "perfect" parameters
- Test changes on historical data before live use
- Document any modifications
### 9. **Leverage Alert De-Duplication**
The indicator prevents spam automatically:
- One alert per unique swing break
- New swing levels = new alerts
- No need to manually filter notifications
### 10. **Supplement with Price Action**
Use the indicator alongside:
- Support/resistance levels
- Order flow footprint charts
- Volume profile
- Market internals (breadth, TICK, etc.)
---
## 📚 Example Scenarios
### Example 1: A++ Premium Setup (Score: 95)
```
Price: In lower 3rd VWAP band (-2.8σ) → VWAP: 25 pts
Structure: Close breaks swing high → Structure: 25 pts
CVD: Price LL + CVD HL (bullish div) → CVD: 25 pts
Time: 10:15 AM NY (market open) → Time: 25 pts
Direction: LONG (price below VWAP) → Valid
Grade: A++ (95/100)
```
**Interpretation:** All factors aligned - premium mean-reversion long opportunity.
---
### Example 2: A+ Strong Setup (Score: 80)
```
Price: In upper 2nd VWAP band (+1.5σ) → VWAP: 15 pts
Structure: Close breaks swing low → Structure: 25 pts
CVD: Price HH + CVD LH (bearish div) → CVD: 25 pts
Time: 2:00 PM NY (off-hours) → Time: 0 pts
Direction: SHORT (price above VWAP) → Valid
Grade: A+ (65/100)
```
**Interpretation:** Strong setup despite off-hours, bearish divergence adds confidence.
---
### Example 3: Filtered Setup (Score: 0)
```
Price: In upper 3rd VWAP band (+2.5σ) → VWAP: 25 pts (if allowed)
Structure: Close breaks swing high → Structure: BLOCKED
CVD: Price HH + CVD HH (confirmation) → CVD: 20 pts (if allowed)
Time: 10:00 AM NY → Time: 25 pts (if allowed)
Direction: LONG (price ABOVE VWAP) → ❌ INVALID ZONE
Grade: None (0/100) - NO ALERT
```
**Interpretation:** VWAP filter blocked long signal in upper band - prevents counter-trend trade.
---
## 🛠️ Troubleshooting
### No Signals Appearing
- ✅ Verify you're on **1-minute chart**
- ✅ Check **Tick Size** matches your symbol
- ✅ Ensure **VWAP Bands** are visible
- ✅ Wait for confirmed pivots (requires at least 5 bars of history)
### Alerts Not Firing
- ✅ Confirm alert is set to **"Once Per Bar Close"**
- ✅ Check score threshold (must be ≥60 by default)
- ✅ Verify VWAP zone filter isn't blocking signals
- ✅ Check that structure shift is actually occurring
### Score Always Zero
- ✅ No structure shift detected (hard gate active)
- ✅ Price may not be in valid VWAP zone (2nd or 3rd band)
- ✅ Insufficient swing history (wait for pivots to form)
### Too Many/Too Few Signals
**Too many signals:**
- Increase **A Setup Threshold** (e.g., 70 instead of 60)
- Increase **Tick Buffer Count** (reduces false breaks)
**Too few signals:**
- Decrease **A Setup Threshold** (e.g., 50 instead of 60)
- Decrease **Tick Buffer Count** (more sensitive to breaks)
---
## 📜 License
This indicator is provided under the **Mozilla Public License 2.0**.
---
## 🤝 Credits
Developed as a professional trading tool for systematic opportunity identification.
**Philosophy:** Reduce noise. Enforce discipline. Keep the human in control.
---
## 📞 Support
For questions, issues, or feature requests, please consult:
1. This README documentation
2. The specification document (`pinescript_market_state_engine_spec.docx`)
3. Inline code comments in `market_state_engine.pine`
---
## 🔄 Version History
**v1.0** (Current)
- Initial release
- 4-component scoring model (VWAP + Structure + CVD + Time)
- VWAP zone directional filtering
- Alert de-duplication
- Configurable inputs
- Real-time score panel
- Session-aware logic
---
## 🎓 Understanding the Numbers
### Quick Reference Card
| Score Range | Grade | Quality | Typical Use |
|-------------|-------|---------|-------------|
| 90-100 | A++ | Premium | Highest conviction trades |
| 75-89 | A+ | High | Strong probability setups |
| 60-74 | A | Good | Acceptable with discretion |
| 0-59 | None | Filtered | Skip or wait for confluence |
### Component Contribution Examples
**Minimum A Setup (60 points):**
- Structure (25) + VWAP 3rd band (25) + Time (25) = 75 ✅
**Typical A+ Setup (75 points):**
- Structure (25) + VWAP 2nd band (15) + CVD confirm (20) + Time (25) = 85 ✅
**Maximum A++ Setup (100 points):**
- Structure (25) + VWAP 3rd band (25) + CVD divergence (25) + Time (25) = 100 ✅
---
## 🎯 Final Reminder
**This is NOT a trading bot.**
**This is NOT financial advice.**
**This is a decision-support tool.**
Always:
- ✅ Use proper risk management
- ✅ Understand the logic before trading
- ✅ Backtest on your symbols
- ✅ Keep the human in control
**Happy Trading! 📈**

TRIZONACCI_Mean reversal_signalsMarket State Engine
Deterministic Confidence-Scoring System for TradingView
A professional-grade PineScript v5 indicator that scores market conditions from 0-100, helping traders identify high-quality trading opportunities through systematic structure analysis, VWAP positioning, order flow dynamics, and time-based context.
🎯 Overview
The Market State Engine is not a trading bot—it's a noise-reduction and opportunity-ranking system designed to filter market conditions and surface only the highest-quality setups.
Instead of blindly taking every signal, this indicator:
✅ Scores market conditions objectively (0-100 scale)
✅ Filters out low-probability setups automatically
✅ Classifies opportunities into A, A+, and A++ grades
✅ Alerts only on confirmed structure shifts with supporting context
✅ Keeps the human in control - provides intelligence, not automation
Philosophy: Reduce Noise. Enforce Discipline. Surface Quality.
🚀 Key Features
Deterministic Scoring - No black boxes, fully explainable logic
Multi-Factor Analysis - Combines 4 independent market state components
Structure-First Approach - Only alerts on confirmed pivot breaks
VWAP Mean Reversion Logic - Directional filtering based on VWAP zones
Order Flow Proxy - CVD divergence and confirmation detection
Session-Aware Scoring - Prioritizes high-volume New York sessions
Alert De-Duplication - One alert per unique structure shift
Zero Repainting - Uses confirmed pivots only (left=2, right=2)
Fully Configurable - All parameters exposed as inputs
Visual Feedback - VWAP bands, setup labels, and real-time score panel
📊 Scoring System (0-100)
The Market State Engine evaluates four independent components, each contributing up to 25 points for a maximum total score of 100.
🎯 Component Breakdown
Component Max Points Description
VWAP Context 25 Measures price deviation from session VWAP
Structure Shift 25 Confirms pivot breakout (HARD GATE)
CVD Alignment 25 Detects order flow divergence/confirmation
Time-of-Day 25 Identifies high-probability trading sessions
1️⃣ VWAP Context (Max 25 Points)
Purpose: Identifies extreme price deviations from fair value for mean-reversion opportunities.
VWAP (Volume-Weighted Average Price) is calculated session-anchored to New York market time, with standard deviation bands creating zones of opportunity.
Band Structure:
1st Band: ±1σ from VWAP (fair value zone)
2nd Band: ±2σ from VWAP (moderate deviation)
3rd Band: ±3σ from VWAP (extreme deviation)
Scoring Logic (Exclusive):
Price in 3rd VWAP Band (>2σ and ≤3σ) → +25 points
Price in 2nd VWAP Band (>1σ and ≤2σ) → +15 points
Otherwise (inside 1σ or beyond 3σ) → 0 points
Key Insight: The further price stretches from VWAP, the higher the probability of mean reversion.
2️⃣ Structure Shift (Max 25 Points) — HARD GATE
Purpose: Confirms momentum shift through confirmed pivot breakouts.
⚠️ CRITICAL: Structure shift is mandatory. If no valid structure shift occurs, the total score becomes 0 regardless of other factors.
Detection Method:
Uses TradingView's ta.pivothigh() and ta.pivotlow() functions with locked parameters:
Left bars: 2
Right bars: 2
Source: Configurable (Wick or Body)
Break confirmation: Candle close only
Bullish Structure Shift:
✅ Prior swing high exists (confirmed pivot)
✅ Current candle closes above swing high + tick buffer
✅ Must occur in VWAP 2nd or 3rd band
✅ VWAP Filter: Price must be at or below VWAP (lower bands)
Bearish Structure Shift:
✅ Prior swing low exists (confirmed pivot)
✅ Current candle closes below swing low - tick buffer
✅ Must occur in VWAP 2nd or 3rd band
✅ VWAP Filter: Price must be at or above VWAP (upper bands)
Scoring:
Valid structure shift → +25 points
No structure shift → Total score = 0
Tick Buffer: Default 5 ticks (configurable) - prevents false breaks from minor price noise.
3️⃣ CVD Alignment (Max 25 Points)
Purpose: Detects institutional order flow through volume delta analysis.
CVD (Cumulative Volume Delta) is a proxy for order flow:
Close > Open → +Volume (buying pressure)
Close < Open → -Volume (selling pressure)
Scoring Logic:
Condition Points Description
Divergence +25 Price makes higher high + CVD makes lower high (bearish)
Price makes lower low + CVD makes higher low (bullish)
Confirmation +20 Price and CVD both make higher highs or lower lows
Neutral 0 No clear divergence or confirmation
Lookback Window: Last 20 bars (configurable) - prevents stale divergences.
Key Insight: Divergences suggest weakening momentum, while confirmations validate the trend.
4️⃣ Time-of-Day Context (Max 25 Points)
Purpose: Prioritizes high-volume, high-volatility New York sessions.
Scored Sessions (America/New_York timezone):
Session Time Range (NY) Points Description
Pre-Market 03:00 - 04:00 +25 Early liquidity injection
Market Open 09:30 - 11:30 +25 Highest volume period
Off-Hours All other times 0 Lower probability setups
Key Insight: Structure shifts during active sessions have higher follow-through probability.
🏆 Setup Classification
Setups are graded based on total score thresholds (configurable):
Grade Score Range Typical Components Quality Level
A++ Setup ≥90 All 4 factors aligned
(VWAP 3rd band + Structure + CVD + Session) Premium - Rare
A+ Setup ≥75 Structure + VWAP + CVD or Session
(3 of 4 factors) High - Select
A Setup ≥60 Structure + VWAP + Session
(Minimum viable setup) Good - Regular
No Grade <60 Insufficient confluence Filtered out
Default Thresholds:
A Setup: 60 points
A+ Setup: 75 points
A++ Setup: 90 points
📥 Installation
Step 1: Download the Indicator
Download the market_state_engine.pine file from this repository.
Step 2: Add to TradingView
Open TradingView
Open the Pine Editor (bottom panel)
Click "New" → "Blank indicator"
Delete all default code
Paste the contents of market_state_engine.pine
Click "Add to Chart"
Step 3: Configure for Your Symbol
Click the gear icon next to the indicator name
Adjust Tick Size for your instrument:
ES futures: 0.25
NQ futures: 0.25
Stocks: 0.01
Save settings
⚙️ Configuration
Symbol Settings
Parameter Default Description
Tick Size 0.25 Minimum price movement for your symbol
Tick Buffer Count 5 Ticks beyond swing for valid break
VWAP Settings
Parameter Default Description
VWAP Band 1 (σ) 1.0 1st standard deviation multiplier
VWAP Band 2 (σ) 2.0 2nd standard deviation multiplier
VWAP Band 3 (σ) 3.0 3rd standard deviation multiplier
Session Settings
Parameter Default Description
Session 1 0300-0400 Pre-market window (NY time)
Session 2 0930-1130 Market open window (NY time)
Score Thresholds
Parameter Default Description
A Setup Threshold 60 Minimum score for A grade
A+ Setup Threshold 75 Minimum score for A+ grade
A++ Setup Threshold 90 Minimum score for A++ grade
CVD Settings
Parameter Default Description
CVD Divergence Lookback 20 Maximum bars for divergence detection
Swing Settings
Parameter Default Options Description
Swing Detection Method Wick Wick / Body Use high/low or open/close for pivots
Visual Settings
Parameter Default Description
Show VWAP Bands ✅ Display VWAP and standard deviation bands
Show Setup Labels ✅ Display setup markers on chart
Show Score Panel ✅ Display real-time score breakdown
📖 How to Use
Step 1: Apply to 1-Minute Chart
⚠️ The indicator is locked to 1-minute timeframe - do not use on other timeframes.
Step 2: Understand the Visual Signals
Setup Labels
Green Triangle (▲) - Bullish (Long) setup detected
Red Triangle (▼) - Bearish (Short) setup detected
Label shows Grade (A/A+/A++) and Total Score
VWAP Bands
Yellow Line - Session VWAP (fair value)
Blue Bands - ±1σ (fair value zone)
Purple Bands - ±2σ (moderate deviation)
Red Bands - ±3σ (extreme deviation)
Score Panel (Top Right)
Real-time breakdown of all four components:
Component Score
VWAP Zone 15/25
Structure 25/25
CVD 20/25
Session 25/25
TOTAL 85/100 (A+)
Step 3: Interpret Signals
Valid Long Setup:
✅ Green triangle below candle
✅ Price in lower VWAP bands (below VWAP)
✅ Structure shift breaks swing high
✅ Score ≥60
Valid Short Setup:
✅ Red triangle above candle
✅ Price in upper VWAP bands (above VWAP)
✅ Structure shift breaks swing low
✅ Score ≥60
Step 4: Set Up Alerts (See Alert Conditions section)
🚦 Signal Filters (VWAP Zone Logic)
The indicator uses directional VWAP filtering to prevent counter-trend signals:
Long Signals (Green)
Only allowed when price is AT or BELOW VWAP
✅ Lower 2nd band (-2σ to -1σ)
✅ Lower 3rd band (-3σ to -2σ)
✅ At VWAP exactly
❌ BLOCKED in upper bands (above VWAP)
Logic: Longs when price is stretched below fair value (mean reversion)
Short Signals (Red)
Only allowed when price is AT or ABOVE VWAP
✅ Upper 2nd band (+1σ to +2σ)
✅ Upper 3rd band (+2σ to +3σ)
✅ At VWAP exactly
❌ BLOCKED in lower bands (below VWAP)
Logic: Shorts when price is stretched above fair value (mean reversion)
🎨 Visual Elements
Chart Overlays
Element Color Description
VWAP Line Yellow Session-anchored fair value
±1σ Bands Blue Fair value zone (no score)
±2σ Bands Purple Moderate deviation (15 pts)
±3σ Bands Red Extreme deviation (25 pts)
Swing Highs Red ▼ Confirmed pivot highs
Swing Lows Green ▲ Confirmed pivot lows
Session Background Light Green Active high-value session
Setup Labels
Bullish Setup:
A+
▲ 75
Green label below candle, shows grade and score
Bearish Setup:
A++
▼ 90
Red label above candle, shows grade and score
Score Panel
Real-time table in top-right corner:
Individual component scores (0-25 each)
Total score (0-100)
Current setup grade (A/A+/A++)
Updates in real-time as market conditions change
🔔 Alert Conditions
Setting Up Alerts
Method 1: Built-in Alert Conditions
Click "Create Alert" in TradingView
Select Market State Engine as condition
Choose alert type:
Bullish Setup - Long signals only
Bearish Setup - Short signals only
Any Setup - All signals
Set to "Once Per Bar Close"
Configure notification method (app, email, webhook)
Method 2: Custom Alert Message
Alert messages include full breakdown:
A+ Setup Detected (Score: 85)
Components: VWAP(25) + Structure(25) + CVD(20) + Time(15)
CVD State: Confirmation
Direction: Long
Timeframe: 1m
Alert Behavior
✅ One alert per unique pivot break - no spam
✅ Fires on candle close only - no repainting
✅ Minimum score filter - only A grade or higher (≥60)
✅ Direction-specific - separate bullish/bearish conditions
⚠️ No cooldown between different pivots - multiple alerts per session allowed if different swing levels break
🔧 Technical Details
Timeframe Lock
Required: 1-minute chart only
Reason: Scoring model calibrated for 1m micro-structure
Future: Multi-timeframe support planned for v2
Timezone Configuration
Hard-coded: America/New_York
Session Detection: Uses TradingView's native session functions
Consistency: All time-based logic uses NY timezone
Swing Detection Parameters
Locked to specification:
ta.pivothigh(source, left=2, right=2)
ta.pivotlow(source, left=2, right=2)
Implications:
Pivots confirmed 2 bars after formation
No repainting - historical pivots don't move
4-bar minimum swing structure (2 left + pivot + 2 right)
VWAP Calculation
Type: Session-anchored (resets daily)
Source: Typical price (high + low + close) / 3
Weighting: Volume-weighted
Standard Deviation: True population standard deviation
CVD Proxy Formula
barDelta = close > open ? volume : close < open ? -volume : 0
CVD = cumulative sum of barDelta (session-reset)
Performance Limits
Max Labels: 500 (TradingView limit)
Max Bars Back: 500
Memory: Lightweight - uses only essential variables
💡 Best Practices
1. Use as a Filter, Not a Strategy
❌ Don't: Blindly take every signal
✅ Do: Use score as confluence for your existing analysis
2. Higher Grades = Better Probability
A Setups (60-74): Regular opportunities, still require discretion
A+ Setups (75-89): High-quality, multiple factors aligned
A++ Setups (90-100): Rare premium opportunities, strongest edge
3. Respect the VWAP Zone Filter
The indicator automatically blocks:
Longs in upper VWAP bands (counter-trend)
Shorts in lower VWAP bands (counter-trend)
Trust this logic - it enforces mean reversion discipline.
4. Monitor the Score Panel
Watch which components are scoring to understand why a setup formed:
Missing CVD score? → No order flow confirmation
Missing Time score? → Outside high-volume sessions
Low VWAP score? → Weak deviation from fair value
5. Combine with Risk Management
The indicator provides opportunity scoring, not position sizing:
Use stop losses based on swing structure
Scale position size with setup grade (larger on A++, smaller on A)
Set profit targets at VWAP or opposing band
6. Session Awareness
Prioritize signals during active sessions:
03:00-04:00 NY: Pre-market momentum
09:30-11:30 NY: Highest volume, tightest spreads
Off-hours signals (0 time score) are lower probability but still valid if other factors strong.
7. Understand the Hard Gate
If no structure shift occurs:
Total score = 0
No alerts fire
Other components irrelevant
Why? Structure shift confirms momentum change - without it, there's no tradable opportunity.
8. Avoid Over-Optimization
Default settings are well-calibrated:
Don't chase "perfect" parameters
Test changes on historical data before live use
Document any modifications
9. Leverage Alert De-Duplication
The indicator prevents spam automatically:
One alert per unique swing break
New swing levels = new alerts
No need to manually filter notifications
10. Supplement with Price Action
Use the indicator alongside:
Support/resistance levels
Order flow footprint charts
Volume profile
Market internals (breadth, TICK, etc.)
📚 Example Scenarios
Example 1: A++ Premium Setup (Score: 95)
Price: In lower 3rd VWAP band (-2.8σ) → VWAP: 25 pts
Structure: Close breaks swing high → Structure: 25 pts
CVD: Price LL + CVD HL (bullish div) → CVD: 25 pts
Time: 10:15 AM NY (market open) → Time: 25 pts
Direction: LONG (price below VWAP) → Valid
Grade: A++ (95/100)
Interpretation: All factors aligned - premium mean-reversion long opportunity.
Example 2: A+ Strong Setup (Score: 80)
Price: In upper 2nd VWAP band (+1.5σ) → VWAP: 15 pts
Structure: Close breaks swing low → Structure: 25 pts
CVD: Price HH + CVD LH (bearish div) → CVD: 25 pts
Time: 2:00 PM NY (off-hours) → Time: 0 pts
Direction: SHORT (price above VWAP) → Valid
Grade: A+ (65/100)
Interpretation: Strong setup despite off-hours, bearish divergence adds confidence.
Example 3: Filtered Setup (Score: 0)
Price: In upper 3rd VWAP band (+2.5σ) → VWAP: 25 pts (if allowed)
Structure: Close breaks swing high → Structure: BLOCKED
CVD: Price HH + CVD HH (confirmation) → CVD: 20 pts (if allowed)
Time: 10:00 AM NY → Time: 25 pts (if allowed)
Direction: LONG (price ABOVE VWAP) → ❌ INVALID ZONE
Grade: None (0/100) - NO ALERT
Interpretation: VWAP filter blocked long signal in upper band - prevents counter-trend trade.
🛠️ Troubleshooting
No Signals Appearing
✅ Verify you're on 1-minute chart
✅ Check Tick Size matches your symbol
✅ Ensure VWAP Bands are visible
✅ Wait for confirmed pivots (requires at least 5 bars of history)
Alerts Not Firing
✅ Confirm alert is set to "Once Per Bar Close"
✅ Check score threshold (must be ≥60 by default)
✅ Verify VWAP zone filter isn't blocking signals
✅ Check that structure shift is actually occurring
Score Always Zero
✅ No structure shift detected (hard gate active)
✅ Price may not be in valid VWAP zone (2nd or 3rd band)
✅ Insufficient swing history (wait for pivots to form)
Too Many/Too Few Signals
Too many signals:
Increase A Setup Threshold (e.g., 70 instead of 60)
Increase Tick Buffer Count (reduces false breaks)
Too few signals:
Decrease A Setup Threshold (e.g., 50 instead of 60)
Decrease Tick Buffer Count (more sensitive to breaks)
📜 License
This indicator is provided under the Mozilla Public License 2.0.
🤝 Credits
Developed as a professional trading tool for systematic opportunity identification.
Philosophy: Reduce noise. Enforce discipline. Keep the human in control.
📞 Support
For questions, issues, or feature requests, please consult:
This README documentation
The specification document (pinescript_market_state_engine_spec.docx)
Inline code comments in market_state_engine.pine
🔄 Version History
v1.0 (Current)
Initial release
4-component scoring model (VWAP + Structure + CVD + Time)
VWAP zone directional filtering
Alert de-duplication
Configurable inputs
Real-time score panel
Session-aware logic
🎓 Understanding the Numbers
Quick Reference Card
Score Range Grade Quality Typical Use
90-100 A++ Premium Highest conviction trades
75-89 A+ High Strong probability setups
60-74 A Good Acceptable with discretion
0-59 None Filtered Skip or wait for confluence
Component Contribution Examples
Minimum A Setup (60 points):
Structure (25) + VWAP 3rd band (25) + Time (25) = 75 ✅
Typical A+ Setup (75 points):
Structure (25) + VWAP 2nd band (15) + CVD confirm (20) + Time (25) = 85 ✅
Maximum A++ Setup (100 points):
Structure (25) + VWAP 3rd band (25) + CVD divergence (25) + Time (25) = 100 ✅
🎯 Final Reminder
This is NOT a trading bot.
This is NOT financial advice.
This is a decision-support tool.
Always:
✅ Use proper risk management
✅ Understand the logic before trading
✅ Backtest on your symbols
✅ Keep the human in control
Happy Trading! 📈

Pro Cumulative Volume RSI# Pro Cumulative Volume RSI - Professional Trading Indicator
## 📊 What is it?
The **Pro Cumulative Volume RSI** is an advanced momentum oscillator that analyzes buying and selling pressure through volume distribution. Unlike traditional RSI that only tracks price movements, this indicator separates volume into buying and selling components, providing two distinct RSI calculations that reveal market dynamics from both perspectives.
## 🔍 How Does It Work?
### Volume Distribution Algorithm
The indicator uses a sophisticated volume distribution method:
**Buying Volume (BV)** = Volume × (Close - Low) / (High - Low)
**Selling Volume (SV)** = Volume × (High - Close) / (High - Low)
This formula proportionally allocates volume based on where the candle closes within its range:
- If close is near the high → More buying volume
- If close is near the low → More selling volume
### Dual RSI Calculation
The indicator then calculates **two separate RSI values**:
1. **Green Line (Buying Volume RSI)**: Measures the dominance of buying pressure
2. **Red Line (Selling Volume RSI)**: Measures the dominance of selling pressure
Each RSI follows the traditional 14-period calculation but applies it to the volume pressure differences rather than price changes.
## 🎯 How to Use It
### Signal Interpretation
| Scenario | Meaning | Action |
|----------|---------|--------|
| Green > 70, Red < 30 | Strong buying dominance | Consider buying / Hold long |
| Red > 70, Green < 30 | Strong selling dominance | Consider selling / Avoid longs |
| Green crosses above Red | Momentum shift to buyers | Potential buy signal |
| Red crosses above Green | Momentum shift to sellers | Potential sell signal |
| Both near 50 | Balanced market | Wait for confirmation |
### Key Features
**1. Crossover Signals**
- **BUY signal**: When green line crosses above red line with sufficient momentum
- **SELL signal**: When red line crosses above green line with sufficient momentum
- Triangle markers appear automatically on the chart
**2. Divergence Detection**
- **Bullish Divergence (DIV+)**: Price makes lower lows but indicator makes higher lows → Potential reversal up
- **Bearish Divergence (DIV-)**: Price makes higher highs but indicator makes lower highs → Potential reversal down
- Yellow/orange circles mark divergences automatically
**3. Background Coloring**
- **Green background**: Buying pressure dominates
- **Red background**: Selling pressure dominates
- Intensity shows strength of pressure
**4. Live Status Table**
- Real-time RSI values for both buying and selling
- Current momentum status
- Market pressure assessment
- Last detected signal
### Settings Customization
**Basic Settings:**
- **RSI Period**: Default 14, adjust based on your trading timeframe (shorter = more sensitive)
**Visual Settings:**
- **Histogram Mode**: Toggle between line and histogram display
- **Background Coloring**: Enable/disable pressure-based background
- **Transparency**: Adjust background opacity
**Signal Settings:**
- **Crossover Signals**: Show/hide BUY/SELL markers
- **Divergence Detection**: Enable automatic divergence spotting
- **Sensitivity**: Low/Medium/High - controls how strong momentum must be for signals
**Level Lines:**
- **Overbought/Oversold**: Adjust threshold levels (default 70/30)
## ⚠️ IMPORTANT DISCLAIMER
### This Indicator Should NOT Be Used Alone
**ALWAYS combine this indicator with other forms of analysis:**
✅ **Price Action Analysis**
- Support and resistance levels
- Trend lines and chart patterns
- Candlestick formations
✅ **Other Technical Indicators**
- Moving Averages (trend confirmation)
- MACD (momentum confirmation)
- Volume Profile (context)
- ATR (volatility assessment)
- Bollinger Bands (volatility and extremes)
✅ **Multiple Timeframe Analysis**
- Check higher timeframes for overall trend
- Use lower timeframes for precise entries
- Ensure signals align across timeframes
✅ **Fundamental Analysis**
- News and economic events
- Earnings reports (for stocks)
- Market sentiment
- Macro conditions
✅ **Risk Management**
- **NEVER** risk more than 1-2% per trade
- Always use stop losses
- Calculate position size before entering
- Have a clear exit strategy
### Common Pitfalls to Avoid
❌ **Don't** take every signal blindly
❌ **Don't** ignore the overall market trend
❌ **Don't** trade against strong momentum without confirmation
❌ **Don't** forget about major support/resistance levels
❌ **Don't** over-leverage based on indicator signals
❌ **Don't** ignore fundamental catalysts
### Best Practices
✅ **Wait for confluence**: Multiple indicators agreeing
✅ **Consider market context**: Bull/bear market conditions
✅ **Use appropriate timeframes**: Match your trading style
✅ **Backtest first**: Test on historical data before live trading
✅ **Keep a trading journal**: Track what works and what doesn't
✅ **Respect your risk management rules**: Always
## 📈 Example Trading Scenarios
### Scenario 1: Strong Trend Following
- **Setup**: Green RSI consistently above 50, price in uptrend
- **Confirmation**: Higher timeframe trend is up, price above major MA
- **Entry**: BUY signal on pullback when green crosses red
- **Stop Loss**: Below recent swing low
- **Exit**: When red RSI crosses above green or divergence appears
### Scenario 2: Reversal Trading
- **Setup**: Bullish divergence (DIV+) appears at support level
- **Confirmation**: Price shows bullish candlestick pattern, other oscillators oversold
- **Entry**: After confirmation candle closes
- **Stop Loss**: Below divergence low
- **Exit**: At resistance or when momentum weakens
### Scenario 3: Avoiding False Signals
- **Signal**: BUY signal appears
- **Check**: Price is at strong resistance, higher timeframe shows downtrend
- **Action**: **SKIP the trade** - context overrides signal
- **Result**: Protected capital by avoiding low-probability setup
## 🎓 Educational Use
This indicator is designed to help traders:
- Understand volume-based momentum
- Identify shifts in market pressure
- Learn about divergence patterns
- Practice multi-indicator analysis
**Remember**: No indicator is perfect. Markets are complex and influenced by countless factors. Use this tool as one piece of your trading puzzle, not as a standalone solution.
## 📞 Support & Updates
- Report bugs or suggest features via comments
- Check back for updates and improvements
- Share your successful setups to help the community learn
## ⚖️ Legal Disclaimer
**This indicator is for educational and informational purposes only.**
- Not financial advice
- Past performance does not guarantee future results
- Trading involves substantial risk of loss
- Only trade with money you can afford to lose
- Consult with a licensed financial advisor before making investment decisions
**The creator of this indicator assumes no responsibility for trading losses incurred through its use.**
---
## 🚀 Happy Trading!
Remember: **Patience, discipline, and proper risk management** are more important than any indicator. Trade smart, trade safe!
*If you find this indicator helpful, please leave a comment and share your experience!*

SPX 0DTE Options War Detector v2 (RELAXED)# SPX 0DTE Options War Detector v2
## Real-Time Contract Acceleration Analysis for Same-Day SPX Options Trading
---
## 🎯 WHAT THIS INDICATOR DOES
The SPX 0DTE Options War Detector identifies when SPX option contracts are moving **significantly faster** than the underlying SPX index itself - a critical signal for 0DTE (zero days to expiration) options traders looking for explosive intraday moves.
**Core Concept:**
When a 1 OTM call contract moves +30% while SPX only moves +0.15%, the **acceleration ratio is 200x**. This indicates gamma expansion, dealer hedging, or strong directional conviction - exactly what creates 100%+ option gains in minutes.
**This indicator tracks that acceleration in real-time and alerts you when contracts are exploding.**
---
## 🔥 KEY FEATURES
### 1. **Real-Time Option Contract Tracking**
- Fetches live prices for your specified call and put option contracts
- Calculates % change over customizable lookback period (default: 3 bars)
- Compares contract movement vs. SPX movement every bar
### 2. **Acceleration Ratio Detection**
- **Calculates: Contract % Change ÷ SPX % Change**
- Signals when ratio exceeds threshold (default: 2x)
- Example: Contract up 40% while SPX up 0.20% = 200x acceleration
### 3. **Multi-Timeframe Alignment (Optional)**
- Checks 1-minute, 5-minute, and 15-minute EMA trends
- Confirms all timeframes agree before entry (can be toggled off)
- Reduces fakeouts by requiring conviction across multiple timeframes
### 4. **Smart Entry Signals**
- 🚀 **Green Arrow (CALL)**: Contract accelerating + SPX rising + bullish alignment
- 🔥 **Red Arrow (PUT)**: Contract accelerating + SPX falling + bearish alignment
- Only triggers during active trading hours (10am-3pm EST default)
### 5. **Automatic Exit Management**
- ❌ **Orange X**: Momentum dying (acceleration drops below 1x)
- ⏱️ **Time Exit**: Automatic exit after 30 minutes max hold
- **"In Trade" Tracking**: Dashboard shows current position status
### 6. **Live Dashboard**
- Real-time contract prices
- % change for calls, puts, and SPX
- Acceleration ratios (with color coding)
- Multi-timeframe alignment status (✓|✓|✓)
- Winner indicator (🏆) showing which side has edge
- Volume status (🔥 surge or 😴 quiet)
- Session status (LIVE or CLOSED)
### 7. **Background Regime Detection**
- 🟢 **Green background**: Calls winning (higher acceleration)
- 🔴 **Red background**: Puts winning (higher acceleration)
- ⚪ **Gray background**: Chop zone (no clear edge)
### 8. **Customizable Alerts**
- CALL ENTRY alert with acceleration details
- PUT ENTRY alert with acceleration details
- EXIT alerts when momentum dies
- All alerts include specific metrics (acceleration ratio, % changes)
---
## 📋 HOW TO USE THIS INDICATOR
### **STEP 1: Daily Setup (Most Important!)**
Every morning before market open:
1. **Open SPX Options Chain** on TradingView
2. **Find current SPX price** (e.g., 6965)
3. **Calculate 1 OTM strikes:**
- Call Strike = SPX + 5 points (e.g., 6970)
- Put Strike = SPX - 5 points (e.g., 6960)
4. **Copy exact ticker symbols** from options chain:
- Example Call: `OPRA:SPXW260113C6970`
- Example Put: `OPRA:SPXW260113P6960`
5. **Update indicator settings:**
- Click gear icon
- Paste Call Option Ticker
- Paste Put Option Ticker
- Save
**Ticker Format:**
- `OPRA:SPXW` = Prefix for SPX weekly options
- `260113` = Expiry date (YYMMDD format, Jan 13, 2026)
- `C` or `P` = Call or Put
- `6970` = Strike price
### **STEP 2: Chart Setup**
- **Symbol**: SPX (S&P 500 Index)
- **Timeframe**: 1-minute chart
- **Session**: Regular market hours (9:30am-4pm EST)
- **Indicator Settings**: Default settings work well for most traders
### **STEP 3: During Trading Hours**
**Watch for Entry Signals:**
1. Monitor the dashboard for acceleration building (50x → 150x → 250x)
2. Check that "WINNER" 🏆 appears on one side consistently
3. Verify volume is 🔥 (if volume filter enabled)
4. **Wait for the arrow to print on chart**
- 🚀 Green arrow up = ENTER CALL
- 🔥 Red arrow down = ENTER PUT
5. Check the label for exact metrics (acceleration, % changes)
**Execute Trade:**
- Entry is MANUAL (indicator provides signals, you execute)
- Enter your chosen contract size
- Set stop loss at -50% contract value (or your risk tolerance)
- Target: 50-150% gain (typical for 0DTE accelerations)
**Exit When:**
- ❌ Orange X appears (momentum dying)
- ⏱️ 30 minutes elapsed (time-based exit)
- Dashboard shows "In Trade: NO"
- Target profit hit
- Stop loss hit
### **STEP 4: Settings Customization**
**Default Settings (Recommended for Starting):**
```
Trading Hours: 10am - 3pm EST
Acceleration Threshold: 2.0x
Contract % Threshold: 3.0%
Lookback Bars: 3
Require All Timeframes: FALSE
Require Volume Surge: FALSE
```
**If Getting Too Many Signals (>20/day):**
- Increase Acceleration Threshold to 3.0x or 4.0x
- Increase Contract % Threshold to 5.0%
- Enable "Require All Timeframes" = TRUE
- Enable "Require Volume Surge" = TRUE
**If Getting Too Few Signals (<5/day):**
- Decrease Acceleration Threshold to 1.5x
- Decrease Contract % Threshold to 2.0%
- Keep both filters OFF
---
## ⚙️ INDICATOR SETTINGS EXPLAINED
### **Core Parameters:**
**Trading Start/End Hour**
- Default: 10am - 3pm EST
- Most volatile 0DTE action happens in these hours
- Adjust if you trade different sessions
**Min Acceleration Ratio**
- Default: 2.0x
- How many times faster contract must move vs. SPX
- Higher = fewer but stronger signals
- Lower = more signals, potentially more noise
**Min Contract % Change**
- Default: 3.0%
- Minimum % gain contract must show
- Filters out tiny movements
- Higher = more selective entries
**Lookback Bars**
- Default: 3 bars (3 minutes on 1min chart)
- Period for calculating % changes
- Shorter = more reactive to quick moves
- Longer = smoother but slower signals
**Require All Timeframes Aligned**
- Default: FALSE (only checks 1min EMA)
- When TRUE: Requires 1min, 5min, AND 15min all aligned
- Use TRUE for highest-quality signals (fewer entries)
- Use FALSE for more opportunities
**Require Volume Surge**
- Default: FALSE
- When TRUE: Only signals when volume >1.5x average
- Confirms conviction behind moves
- Can miss quiet but powerful setups if enabled
### **Option Ticker Inputs:**
**Call Option Ticker**
- MUST be updated daily for 0DTE trading
- Format: `OPRA:SPXW `
- Example: `OPRA:SPXW260113C6970`
- Find in TradingView's SPX Options Chain
**Put Option Ticker**
- MUST be updated daily for 0DTE trading
- Format: `OPRA:SPXW `
- Example: `OPRA:SPXW260113P6960`
- Usually 5-10 points below ATM strike
---
## 📊 UNDERSTANDING THE DASHBOARD
### **Dashboard Fields:**
**Price** → Current option contract price
**% Change** → Contract % change over lookback period (green = up, red = down)
**Accel Ratio** → Contract % ÷ SPX % (green if >threshold)
**SPX % Chg** → SPX index % change
**1m|5m|15m** → Timeframe alignment (✓ = aligned, ✗ = not aligned)
**WINNER** → 🏆 appears on side with higher acceleration
**Volume** → 🔥 = surge, 😴 = quiet
**In Trade** → YES = currently tracking a position, NO = flat
**Session** → LIVE = trading hours active, CLOSED = outside hours
### **What to Look For:**
**Strong CALL Setup:**
```
Price: 45.2
% Change: +38% (green)
Accel Ratio: 250x (green - above threshold)
SPX % Chg: +0.15%
1m|5m|15m: ✓|✓|✓ (all aligned)
WINNER: 🏆 (call side)
Volume: 🔥
In Trade: NO (ready for entry)
Session: LIVE
```
→ Wait for 🚀 green arrow, then consider entry
**Strong PUT Setup:**
```
Price: 52.8
% Change: +45% (green)
Accel Ratio: 225x (green)
SPX % Chg: -0.20%
1m|5m|15m: ✓|✓|✓ (all aligned)
WINNER: 🏆 (put side)
Volume: 🔥
In Trade: NO
Session: LIVE
```
→ Wait for 🔥 red arrow, then consider entry
---
## 💡 BEST PRACTICES
### **DO:**
✅ Update option tickers EVERY morning
✅ Wait for the arrow signal (don't trade dashboard alone)
✅ Exit when orange X appears (momentum dying)
✅ Respect the 30-minute max hold time
✅ Only trade during high-volume periods (🔥)
✅ Start with paper trading for 5-10 days
✅ Track your actual results (not just signals)
✅ Use proper position sizing (risk 1-2% of account per trade)
### **DON'T:**
❌ Trade without updating tickers daily
❌ Chase signals after arrow already printed
❌ Hold past exit signals "hoping" for recovery
❌ Trade during lunch hour (low volume)
❌ Take every signal (filter for best setups)
❌ Ignore timeframe alignment when enabled
❌ Trade outside 10am-3pm window (lower liquidity)
❌ Risk more than you can afford to lose
---
## 🎯 TYPICAL USE CASES
### **Case 1: Scalper (Multiple Trades Per Day)**
- Settings: Acceleration 2.0x, All filters OFF
- Expectation: 15-20 signals per day
- Strategy: Take 5-8 best setups (🔥 volume + ✓|✓|✓ alignment)
- Hold Time: 3-10 minutes
- Target: 50-100% per trade
### **Case 2: Selective Trader (Quality Over Quantity)**
- Settings: Acceleration 3.0x, All filters ON
- Expectation: 5-8 signals per day
- Strategy: Take every signal with conviction
- Hold Time: 10-20 minutes
- Target: 100-150% per trade
### **Case 3: Trend Rider (Momentum Continuation)**
- Settings: Acceleration 2.5x, Volume ON, Timeframes OFF
- Expectation: 10-15 signals per day
- Strategy: Take signals that align with market trend
- Hold Time: 15-30 minutes
- Target: 75-125% per trade
---
## ⚠️ IMPORTANT DISCLAIMERS
### **Risk Warning:**
- 0DTE options are EXTREMELY high risk
- You can lose 100% of position in minutes
- Only trade with money you can afford to lose completely
- This indicator does NOT guarantee profits
- Past performance does not indicate future results
### **Not Financial Advice:**
- This is an educational tool for analyzing option acceleration
- Not a recommendation to buy or sell any security
- Consult a licensed financial advisor before trading
- The creator assumes no liability for trading losses
### **Technical Limitations:**
- Requires real-time option data subscription
- Option tickers MUST be updated daily for 0DTE
- Signals are based on historical patterns (not predictive)
- Acceleration can reverse instantly (use stops always)
- Low liquidity contracts may show false signals
### **Market Conditions:**
- Works best in trending markets (strong directional moves)
- Less effective in choppy/range-bound conditions
- High volatility days produce more signals
- Quiet days may produce few or no signals
---
## 🚀 EXPECTED RESULTS
### **Signal Frequency:**
- **Relaxed Settings**: 15-20 signals per day
- **Balanced Settings**: 10-15 signals per day
- **Strict Settings**: 5-8 signals per day
### **Signal Quality:**
- **Not every signal is a trade** (filter for best setups)
- **Trending days = more signals** (this is normal)
- **Chop days = fewer quality signals** (be patient)
- **Exit signals are fast** (3-10 minutes typical for 0DTE)
### **Win Rate Expectations (Realistic):**
- **Beginner**: 40-50% win rate
- **Intermediate**: 50-60% win rate
- **Advanced**: 60-70% win rate
- **Risk/Reward**: Target 1:1 to 1:3 (with discipline)
### **Performance Factors:**
- Your entry timing (taking best vs. all signals)
- Your exit discipline (following stops)
- Market conditions (trending vs. chop)
- Position sizing (proper risk management)
- Experience level (paper trade first!)
---
## 🔧 TROUBLESHOOTING
### **"Dashboard shows NaN"**
→ Option ticker not found or no data
→ Verify ticker format is correct
→ Check strike is not too far OTM (use 1-2 OTM only)
### **"No signals generating"**
→ Check "Session" shows LIVE
→ Lower acceleration threshold (try 1.5x)
→ Disable all filters temporarily
→ Verify option tickers updated for today
### **"Too many signals"**
→ Increase acceleration to 3x or higher
→ Enable "Require All Timeframes" = TRUE
→ Enable "Require Volume Surge" = TRUE
→ Increase contract % to 5-7%
### **"Exit warnings without entries"**
→ Fixed in V2 (only shows when "In Trade: YES")
→ If still appearing, indicator may need refresh
### **"Only CALL or only PUT signals"**
→ This is NORMAL on trending days
→ Market dictates which side has edge
→ System working correctly if directional
---
## 📚 ADDITIONAL RESOURCES
### **Recommended Learning:**
- SPX 0DTE options basics and mechanics
- Gamma risk and dealer hedging concepts
- Option acceleration vs. underlying movement
- Proper position sizing and risk management
- Backtesting vs. forward testing methodology
### **Complementary Tools:**
- Bookmap (order flow analysis)
- Volume profile indicators
- Opening range breakout tools
- Volatility index (VIX) monitoring
### **Community:**
- Share your results and optimizations
- Discuss settings for different market conditions
- Report bugs or suggest improvements
- Help other traders learn the system
---
## 📝 VERSION HISTORY
**v2.0 - Relaxed Entry Conditions**
- Removed new high/low requirement (too strict)
- Made multi-timeframe alignment optional
- Made volume surge optional
- Added "In Trade" tracking to dashboard
- Fixed exit warnings appearing without entries
- Lowered default contract % threshold to 3%
**v1.0 - Initial Release**
- Core acceleration detection logic
- Multi-timeframe EMA alignment
- Dashboard with real-time metrics
- Entry and exit signal system
- Basic alert structure
---
## 🤝 CREDITS & ATTRIBUTION
**Concept:** Contract acceleration detection for 0DTE SPX options
**Methodology:** Real-time comparison of option contract movement vs. underlying index movement
**Target Audience:** Active 0DTE options traders seeking explosive intraday moves
**Development:** Collaborative refinement through live testing and user feedback
**Open Source:** This script is published for the trading community. Feel free to modify and improve, but please credit the original work.
---
## 💬 FINAL NOTES
This indicator was built by traders, for traders who understand that 0DTE options require:
- **Speed** (decisions in seconds)
- **Precision** (knowing when contracts are truly accelerating)
- **Discipline** (following exits without emotion)
- **Risk Management** (proper sizing and stops)
If you use this tool, you accept the risks. If you profit from it, pay it forward by helping others learn.
**Trade smart. Trade small. Trade safe.**
---
## 📞 SUPPORT & FEEDBACK
If this indicator helps you, please:
- ⭐ Leave a review
- 📊 Share your optimization settings
- 🐛 Report any bugs or issues
- 💡 Suggest improvements
**Good luck, and may your acceleration ratios be ever in your favor!**
---
*Disclaimer: This indicator is for educational and informational purposes only. Trading options involves substantial risk of loss. The creator makes no guarantees of profitability and assumes no liability for trading decisions made using this tool.*

Allyhshn - OrderFlowAllyhshn – OrderFlow
Dynamic Order Flow, Volume Delta & Price-Based Flow visualization
Is an advanced order flow and volume-by-price visualization indicator designed to work on any TradingView account, using public volume data and lower-timeframe aggregation to approximate professional order-flow behavior.
The script combines delta analysis, dynamic volume (bubbles), price-region (snapshot ladders), real-time flow tracking, delivering a comprehensive snapshot of buyer and seller activity directly on the chart.
1) Core Concept
The indicator estimates order flow by:
* Aggregating volume from lower timeframes.
* Classifying volume as buying or selling pressure.
* Distributing volume into price bins.
* Rendering this information as visual bubbles, ladder tables, and real-time labels.
This approach allows traders to identify:
* Aggressive buying or selling.
* Absorption and institutional participation.
* Acceptance or rejection of price levels.
* High-interest price zones (POC and volume clusters).
2) Order Flow & Delta Calculation
Delta Estimation
* Delta is calculated as the difference between buying and selling volume.
* On second-based charts, delta is computed directly from candle behavior.
* On higher timeframes, delta is reconstructed from lower timeframes
Wick-Based Classification (Optional)
* When enabled, volume classification uses **wick and candle position** rather than only
open/close.
This improves detection of:
* Absorptions;
* Rejections;
* True control of the candle (buyers vs sellers).
3) Delta Normalization & Thresholds
To maintain consistency across different market regimes:
* Absolute delta is normalized using an EMA-based baseline.
* A configurable threshold factor filters out weak or irrelevant volume.
* Only significant aggressions generate visual signals.
This makes signals comparable across:
* Low-volume sessions.
* High volatility.
* News events.
* Consolidation phases.
4) Dynamic Volume Bubbles (Order Flow Visualization)
Bubble Logic
* Buy and sell aggressions are rendered as bubbles on the chart.
* Bubble size dynamically reflects the relative strength of delta.
* Sizes adapt automatically to market conditions.
Real-Time Behavior:
* During the active candle, bubbles:
* Expand as volume accumulates.
* Update continuously.
* Reflect real-time changes in order flow.
* Buy and sell bubbles are mutually exclusive unless both sides are active.
Historical Bubbles:
* Confirmed candles store bubbles in history.
* The total number of displayed bubbles is limited to avoid clutter.
* Optional **institutional-only mode** displays only extreme or absorbed events.
5) Absorption & Institutional Event Detection
The script can isolate high-impact volume events by:
* Requiring delta to exceed a dynamic threshold;
* Filtering only extreme or abnormal volume behavior;
* Highlighting potential institutional absorption zones.
Bubble sizing becomes more aggressive in this mode, emphasizing:
* Large participants.
* Defended price levels.
* Failed auctions.
6) Vertical & Horizontal Positioning
* Bubble placement is offset vertically using ATR-based padding, ensuring clarity.
* Labels and bubbles never overlap candles.
* Horizontal offsets are configurable for right-side labels.
7) Ladder – Order Flow by Price (Flow Snapshot)
Purpose:
The Ladder provides a price-based snapshot of order flow,
similar to a volume profile combined with delta.
Features:
* Aggregates buy, sell, and total volume by price regions (bins).
* Uses fixed tick-based bins for accurate price granularity.
* Automatically adapts to the visible range or fallback lookback.
Range Modes:
*ATR Mode: Ladder range adapts dynamically to volatility.
*ABS Mode: Ladder uses a fixed price range defined by scale and units.
Display Options
* Price level.
* Bought volume.
* Sold volume.
* Total volume.
* Compact number formatting (K/M).
8) Point of Control (POC)
* The ladder automatically identifies the Point of Control.
* The price region with the highest total volume.
* The POC row can be visually highlighted.
This helps identify:
* Acceptance zones.
* Fair value areas.
* High-interest liquidity levels.
9) Real-Time Overlay on Ladder
* The current candle’s live delta is overlayed on the ladder in real time.
* This ensures the ladder always reflects the most current order flow state.
* Traders can see developing volume before candle close.
10) Right Mini Labels – Last Candle Snapshot
A compact label panel on the right side displays:
* Buyers volume.
* Sellers volume.
* Optional total volume.
These values:
* Update in real time.
* Reset at each new candle.
* Reflect only the current bar’s order flow.
This provides a quick, readable snapshot without scanning the entire ladder.
11) Data Management & Performance
* Uses rolling arrays to maintain performance.
* Automatically removes outdated price bins.
* Prevents memory growth with fixed limits.
* Designed to remain stable even on fast markets and low timeframes.
12) Intended Use Cases
This script is suitable for:
* Scalping and intraday trading.
* Identifying absorption and manipulation.
* Confirming breakouts and failures.
* Reading auction behavior.
* Enhancing entries and exits with order flow context.
13) Account Compatibility
* Does not require proprietary order book or footprint data.
* Works on all TradingView accounts.
* Uses only publicly available volume information.

Auction Context Engine ( Value Area, VWAP & Regime)📌 Indicator Name
Auction Context Engine (Value Area, VWAP & Regime)
Short name: ACE Context
🧠 Description
Auction Context Engine (ACE) is a professional market context and structure indicator based on Auction Market Theory.It is designed to help traders understand where the market is positioned, not to generate trade signals.
ACE focuses on:
• Developing Value Area (VAH / VAL)
• Developing Point of Control (POC)
• Session VWAP positioning
• Volatility regime expansion
• Opening Range context
• Failed auction / trap detection
• Market bias and environment quality
This indicator provides context only and is intended to be used alongside a separate execution strategy or system.
🎯 What This Indicator Is
✔ A context engine
✔ A market structure filter
✔ A bias alignment tool
✔ A regime and environment classifier
❌ What This Indicator Is NOT
✘ Not a signal generator
✘ Not a buy/sell system
✘ Not a strategy
✘ Not a profitability promise
📊 How To Use
Use ACE to answer:
• Is price accepting or rejecting value?
• Is the market in balance or expansion?
• Is VWAP supporting or opposing price?
• Is this a breakout environment or a trap?
• Is volatility expanding?
• Is the market trending or ranging?
You may then use your own execution strategy aligned with this context.
🟢 Core Components
Developing Value Area
• VAH / VAL dynamically update through the session
• POC tracks highest traded volume area
VWAP Position
• Above VWAP = bullish bias
• Below VWAP = bearish bias
Opening Range Context
• Detects breakouts or balance after session open
Volatility Regime
• Identifies expansion vs normal conditions
Failed Auction Detection
• Highlights trap conditions near value extremes
Market Quality
• Strong / Mixed / Weak environment classification
Context Table
• Clean 1-column vertical dashboard with color-coded bias
🔵 Visual Elements
• Developing VAH, VAL, POC lines
• Session VWAP
• Small context dots when environment turns READY
• Compact professional context table
⚙️ Settings
• Value Area bin size
• Value area percentage
• Opening range duration
• Regime expansion factor
• Line colors and thickness
• Context table ON/OFF
• Context dots ON/OFF
🧩 Best Use Case
This indicator is ideal for:
• Intraday trading
• Index futures and equities
• Options context filtering
• Trend / range regime identification
• Professional discretionary traders
⚠️ Disclaimer
This script is provided for educational and informational purposes only.It does not constitute financial or investment advice.Trading involves risk. Always use proper risk management.

CVD Absorption & Distribution Pro v3 (With Logit Regression)CVD Absorption & Distribution Pro v3 - Complete Guide
Introduction and Overview
The CVD Absorption and Distribution Pro v3 is an advanced trading indicator designed for TradingView that reveals hidden market dynamics invisible on standard price charts. This tool analyzes the battle between buyers and sellers at the micro level, identifying when large institutional players are quietly accumulating or distributing positions while price remains deceptively stable.
Traditional volume indicators fail traders because they treat all volume the same way. They cannot distinguish between aggressive buying and aggressive selling. More importantly, they cannot reveal when significant selling pressure is being absorbed by hidden buyers, or when strong buying pressure is being quietly distributed by large sellers. This information asymmetry has historically given institutional traders a massive advantage over retail participants.
This indicator solves that problem by implementing Cumulative Volume Delta analysis combined with machine learning prediction models, hidden liquidity detection, and comprehensive statistical validation. The result is a professional-grade analytical tool that was previously available only on expensive specialized platforms, now accessible to the entire TradingView community.
What is Cumulative Volume Delta
Cumulative Volume Delta, commonly known as CVD, is a method of categorizing trading volume based on whether it represents buying or selling pressure. The concept is straightforward. When price ticks upward from one moment to the next, the volume associated with that price movement is classified as buying volume. When price ticks downward, that volume is classified as selling volume. The difference between total buying volume and total selling volume over a given period is the delta.
A positive delta indicates that buyers were more aggressive during that period. A negative delta indicates sellers were more aggressive. By tracking this delta cumulatively over time, traders can see the underlying pressure that may not be immediately visible in price action alone.
However, raw CVD analysis has limitations. The real trading edge emerges when we compare what the CVD suggested should happen to price versus what actually happened. When there is significant selling pressure but price fails to decline, something interesting is occurring. Someone is absorbing all that selling. This is where the concepts of absorption and distribution become critically important.
Core Functionality Explained
The indicator operates by accessing one-second bar data from TradingView, the finest granularity available on the platform. This micro-level data is then grouped into clusters, which are user-configurable time blocks. The default setting creates clusters of sixty one-second bars, effectively creating one-minute analysis blocks. However, traders can adjust this to create clusters representing anywhere from a few seconds to several minutes depending on their trading style.
For each one-second bar within a cluster, the script must determine whether to classify the volume as buying or selling. This classification happens based on whether price moved up or down compared to the previous bar. But what happens when price does not change at all? The indicator provides three methods to handle this situation.
The first method, called Last Direction, assigns unchanged volume to whichever direction occurred most recently. If the previous tick was an uptick, the unchanged volume is counted as buying. This approach assumes market momentum tends to persist at very short timeframes.
The second method, called Split Fifty-Fifty, divides unchanged volume equally between buying and selling. This conservative approach acknowledges that when price does not move, we genuinely cannot know whether buyers or sellers were responsible.
The third method simply ignores unchanged ticks entirely, excluding them from the CVD calculation. This purist approach ensures only directionally confirmed volume influences the analysis.
Understanding Absorption
Absorption is one of the two primary signals this indicator detects. Absorption occurs when significant selling pressure fails to push price lower. Imagine a scenario where the delta is strongly negative, meaning sellers are aggressively hitting bids and overwhelming buyers. Under normal circumstances, this should drive price down. But if price stays flat or even rises despite this selling pressure, something unusual is happening. A large buyer is absorbing all that selling without allowing price to fall.
This behavior is characteristic of institutional accumulation. Large players who want to build substantial positions cannot simply place massive buy orders because that would move price against them immediately. Instead, they often buy by absorbing selling pressure. They let other participants sell to them at stable prices, quietly accumulating shares without revealing their intentions.
The indicator identifies absorption by first checking whether the CVD magnitude exceeds a calculated threshold based on historical averages. If the CVD is significantly negative and exceeds this threshold, the script then examines what happened to price. If price moved up or stayed flat, this is classified as full absorption. If price moved down but moved less than expected given the selling pressure, this is classified as partial absorption.
The expected price move is calculated based on the relationship between CVD magnitude and typical price movement observed historically. If current CVD is twice the average, the expected price move would be approximately twice the average price move. When actual price movement falls short of this expectation, the shortfall percentage quantifies the absorption.
Understanding Distribution
Distribution is the mirror image of absorption. It occurs when significant buying pressure fails to push price higher. When delta is strongly positive but price stays flat or even declines, someone is distributing shares into that buying pressure. They are selling to eager buyers without allowing price to rise.
This behavior characterizes institutional distribution. Large holders who want to exit substantial positions face the same challenge as accumulators. They cannot simply dump massive sell orders because that would crash the price before they finish selling. Instead, they often sell by distributing into buying pressure, letting other participants buy from them at stable prices while quietly reducing their position.
The indicator identifies distribution using the same logic as absorption but in reverse. Strongly positive CVD that exceeds the threshold combined with flat or declining price signals distribution. Partial distribution is identified when price rises but rises less than the CVD magnitude would suggest.
Hidden Liquidity Detection
Perhaps the most valuable feature of this indicator is its ability to quantify hidden liquidity. Hidden liquidity refers to large orders that are not fully visible in the order book. Institutional traders commonly use iceberg orders, which display only a small portion of the total order size while the rest remains hidden. As the visible portion gets filled, more of the hidden quantity is revealed.
The indicator estimates hidden liquidity by analyzing partial absorption and partial distribution events. When price moves less than expected given the CVD, the difference represents volume that was absorbed by hidden orders. The cumulative hidden buy liquidity and hidden sell liquidity provide insight into institutional activity that remains completely invisible on standard charts.
A high ratio of hidden buy liquidity to hidden sell liquidity suggests institutional accumulation is occurring. Conversely, a high ratio of hidden sell liquidity to hidden buy liquidity suggests institutional distribution. These signals often precede significant price movements as the institutional positioning eventually influences market direction.
The Prediction Model
This indicator goes beyond simple pattern detection by implementing a genuine machine learning model trained on historical data. The model uses logistic regression to predict whether price will move up or down in subsequent clusters based on current market conditions.
The model considers three primary factors. First, it looks at the normalized CVD, which measures current CVD relative to its historical average and variability. Second, it examines net flow, which is the difference between absorption and distribution. Third, it analyzes hidden flow, the difference between hidden buy liquidity and hidden sell liquidity.
During the training process, the model examines historical clusters where price actually moved significantly. It learns the relationship between these three factors and subsequent price direction. Through iterative gradient descent, the model adjusts its coefficients to best fit the historical data.
The output is a probability between zero and one representing the likelihood that the next cluster will see upward price movement. A probability above sixty percent suggests bullish conditions. A probability below forty percent suggests bearish conditions. Values between forty-five and fifty-five percent indicate neutral or uncertain conditions.
Model Validation Metrics
The indicator provides several metrics to help traders assess whether the prediction model is actually useful for the specific instrument they are analyzing. This validation is critically important because not all instruments exhibit predictable CVD-price relationships.
Logistic Accuracy shows the percentage of correct binary predictions across the training window. An accuracy of fifty percent is essentially random, providing no edge. Accuracy above fifty-five percent suggests the model has genuine predictive value.
Sign Agreement Rate measures how often CVD direction matched price direction historically. When CVD is positive and price goes up, or when CVD is negative and price goes down, this counts as agreement. A sign agreement rate significantly above fifty percent indicates that CVD provides useful directional information for this instrument.
Weighted Sign Agreement applies the same concept but weights each observation by CVD magnitude. High-magnitude CVD events that correctly predict direction count more than low-magnitude events. This metric reveals whether strong CVD signals are more reliable than weak ones.
If these validation metrics are close to fifty percent, traders should be cautious about relying on the model for that particular instrument. The CVD-price relationship may be too noisy or the market microstructure may not suit this type of analysis.
Bucket Analysis
The indicator performs bucket analysis by segmenting historical data into five groups based on CVD magnitude. The first bucket contains clusters where CVD was very strongly negative, more than twice the average in the negative direction. The second bucket contains moderately negative CVD clusters. The third bucket represents neutral conditions where CVD was within one standard average of zero in either direction. The fourth bucket contains moderately positive CVD, and the fifth bucket contains very strongly positive CVD.
For each bucket, the indicator calculates what percentage of clusters saw price move upward. In a market where CVD has predictive value, we would expect to see low upward percentages in negative CVD buckets and high upward percentages in positive CVD buckets. The spread between the highest and lowest buckets indicates how useful CVD is for predicting direction.
If the bucket analysis shows similar upward percentages across all buckets, the CVD-price relationship is essentially random for that instrument. If the pattern shows the expected gradient from low to high, CVD analysis should provide genuine trading edge.
Strength Tiers
Not all absorption and distribution events are equally significant. The indicator classifies events into three strength tiers based on their magnitude relative to baseline averages.
Normal events occur when CVD is between one and two times the average magnitude. These events happen regularly throughout trading sessions and represent standard market dynamics.
Strong events occur when CVD is between two and three times the average magnitude. These elevated significance events warrant additional attention and may indicate more substantial institutional activity.
Exceptional events occur when CVD exceeds three times the average magnitude. These rare occurrences often precede significant price movements and represent major institutional footprints in the market.
The indicator tracks how many events of each tier occurred during the display period, helping traders identify sessions with unusual institutional activity.
Divergence Detection
The indicator implements sophisticated divergence detection that compares trends in CVD with trends in price over a rolling window of recent clusters. Divergence occurs when these two metrics move in opposite directions or when one moves significantly while the other remains flat.
Bullish divergence manifests in two forms. Hidden accumulation occurs when the CVD trend turns increasingly positive while price remains flat, suggesting buying pressure is building without yet moving price. CVD accumulation occurs when average CVD is positive but average price movement is minimal.
Bearish divergence also manifests in two forms. Hidden distribution occurs when CVD trend turns increasingly negative while price remains stable, suggesting selling pressure is building. CVD distribution occurs when average CVD is negative but price refuses to decline.
Divergence signals are quantified by their strength relative to baseline averages, allowing traders to prioritize the most significant divergences.
Display and Interface
The indicator presents all its analysis through a comprehensive table overlay positioned on the chart. The table is organized into logical sections that can be individually enabled or disabled based on trader preferences.
The Direction Prediction section shows the current signal, probability, and period cluster breakdown between bullish, bearish, and neutral predictions. The Model Performance section displays accuracy metrics and training sample counts.
The CVD Bucket Analysis section shows the five-bucket breakdown with upward percentages for each, along with an interpretation of whether a predictable pattern exists.
The Baselines section displays the calculated averages for CVD and price movement, along with the current threshold being used for event detection.
The Results section shows total absorption and distribution for the display period, the ratio between them, net values, and an overall flow signal interpretation.
The Full versus Partial section breaks down events by type, showing how much activity was full absorption or distribution versus partial events indicating hidden liquidity.
The Hidden Liquidity section displays estimated hidden buy and sell volumes, their ratio, average shortfall percentages, and an iceberg signal interpretation.
The Strength Tiers section shows event counts by tier for both absorption and distribution, highlighting any exceptional events.
The Divergence section indicates whether bullish or bearish divergence is currently present and its strength.
The Statistics section provides cluster counts and event counts for reference.
Configuration Recommendations
For scalping and very short-term trading with holding periods of one to five minutes, traders should use smaller cluster sizes around thirty to sixty seconds, shorter average lengths around two to three hundred clusters, and enable intensity weighting to emphasize high-magnitude events.
For day trading with holding periods of fifteen to sixty minutes, the default settings work well. Cluster size of sixty for one-minute analysis, average length of seven hundred fifty for approximately two trading days of history, and single-day display period provide balanced analysis.
For swing trading with multi-day holding periods, larger cluster sizes of three hundred to six hundred representing five to ten minute blocks reduce noise. Longer average lengths of seven fifty to fifteen hundred clusters capture broader patterns. Multi-day display periods of three to five days reveal accumulation and distribution over meaningful timeframes.
Interpreting Results
When the absorption to distribution ratio exceeds one point five, this suggests bullish underpinnings. Selling pressure is being absorbed, potentially indicating institutional accumulation. Traders should look for confirmation from hidden buy liquidity metrics, model probability favoring upside, and any bullish divergence signals.
When the ratio falls below zero point six seven, this suggests bearish underpinnings. Buying pressure is meeting distribution, potentially indicating institutional selling. Validate with hidden sell liquidity metrics, model probability favoring downside, and any bearish divergence signals.
When the ratio falls between zero point eight and one point two, the market is in relative equilibrium. Traders should wait for the ratio to break out of this neutral range, watch for exceptional tier events that might signal a shift, or wait for divergence to develop.
Regarding model predictions, when accuracy exceeds fifty-eight percent and sign agreement exceeds fifty-five percent, there is a strong predictive relationship. CVD analysis provides genuine edge for this instrument. When accuracy falls between fifty-four and fifty-eight percent or sign agreement falls between fifty-two and fifty-five percent, there is moderate edge. Use signals for confirmation but not as standalone entry triggers. When both metrics fall below their respective thresholds, the relationship is weak or random. Traders should reconsider whether CVD analysis adds value for this particular instrument.
Best Practices
Allow adequate training time before relying on model predictions. The prediction model requires substantial data to train effectively. Ensure at least five hundred clusters have accumulated before trusting model outputs. The indicator displays training sample count for verification.
Always validate model quality before trading based on predictions. A fifty-two percent accuracy is statistically indistinguishable from random chance. Ensure your edge is real by checking all validation metrics.
Context matters tremendously in interpretation. Absorption during an established uptrend suggests continuation strength. Absorption during a downtrend suggests potential reversal. Always interpret signals within the broader market context rather than in isolation.
Combine this indicator with price action analysis. The CVD analysis reveals hidden dynamics but should not be used alone. Combine with support and resistance levels, trend structure analysis, volume profile, and traditional technical patterns for comprehensive market assessment.
Monitor for regime changes over time. Market microstructure can change as participation patterns evolve. Regularly review bucket analysis to ensure the CVD-price relationship remains stable. Significant deterioration in predictive patterns may indicate changing market conditions requiring parameter recalibration.
Value to the Trading Community
This indicator democratizes institutional-grade analysis. Historically, this level of order flow analysis required expensive specialized platforms that cost hundreds or thousands of dollars monthly. By implementing these concepts within TradingView Pine Script, this tool makes professional analysis accessible to all traders regardless of budget.
The indicator serves as an educational framework. Beyond practical trading applications, the visible statistics help traders understand the CVD-price relationship. Bucket analysis teaches probabilistic thinking. Model coefficients reveal which factors matter most. Validation metrics prevent overconfidence in unreliable signals.
The customization depth accommodates diverse trading styles. With over thirty configurable parameters, the indicator adapts to virtually any approach from rapid scalping to patient swing trading.
The transparent methodology builds trust. Unlike black-box commercial solutions where algorithms remain hidden, every calculation is visible in the source code. Traders can verify the logic, understand the assumptions, and modify the approach to suit their specific needs.
Conclusion
The CVD Absorption and Distribution Pro v3 represents a significant advancement in accessible order flow analysis for retail traders. By combining time-tested CVD concepts with modern statistical validation and machine learning techniques, it provides a comprehensive toolkit for understanding the hidden dynamics driving price action.
Its value lies not merely in generating trading signals but in providing the framework to understand why those signals occur and whether they are statistically meaningful for the specific instrument being traded. This combination of actionable intelligence and educational transparency makes it an invaluable addition to any serious trader analytical arsenal.
The indicator rewards those who invest time in understanding its methodology, optimizing its parameters for their specific trading style, and validating its signals against their own market experience. Used thoughtfully, it reveals the institutional footprints that remain invisible on conventional charts. The absorption, distribution, and hidden liquidity patterns it detects often presage significant market movements, giving attentive traders the opportunity to position themselves alongside smart money rather than against it.

deKoder | Whale Prints [WP]deKoder | Whale Prints | Large Trade Orderflow Detection
This open-source indicator is a clean, precision tool for revealing hidden large-volume activity directly on your chart. By scanning ultra-low timeframes while you view higher ones, it projects statistically significant volume spikes as intuitive markers giving you a clear window into institutional orderflow without visually overwhelming the price action.
Key Features & Strengths
True Intra-Bar Detection | Monitors lower timeframes down to 1-second bars, catching aggressive block trades and absorption that occur within a single higher-TF candle.
Accurate Trade Levels | Markers are placed at the actual hl2 price of the aggressive lower-TF bar, providing a far more accurate estimate of where the large trade executed than typical mid-candle approximations.
Multiple Trades Per Bar | If several significant volume spikes occur inside one higher-TF candle, all qualifying levels are displayed individually – offering greater granularity and context.
Adaptive Thresholding | Uses higher-TF volume standard deviation (stable baseline) intelligently scaled to the lower timeframe, reducing noise in quiet markets while remaining sensitive to genuine outliers.
Clean Visual Hierarchy | Three tiers (Small 🞉 / Medium ⏣ / Large 🞊) with dynamic symbol size, line thickness, transparency, and user-definable bullish/bearish coloring based on LTF candle direction.
How to Use It as an Orderflow Tool
Large volume spikes often mark the footprints of institutional players. This indicator helps you read those footprints in real time.
Small (🞉) | Moderate excess volume: early interest, probing, or building positions.
Medium (⏣) | Strong spike: increasing conviction, potential momentum shift.
Large (🞊) | Extreme outlier: frequently climactic volume signalling exhaustion or major absorption.
Why Price Often Reverses at These Levels
Large players frequently place limit orders in areas rich with liquidity – commonly just beyond recent highs/lows where retail stop-losses cluster. When price sweeps those zones:
Stop hunts trigger a cascade of forced exits, creating liquidity for larger participants to fill their limit orders.
Breakout traders who entered on the move are trapped offside and become forced buyers/sellers when price reverses.
Institutions use this liquidity to execute large orders at favorable prices with minimal immediate market impact.
The result is aggressive volume at the extreme, followed by reversal as smart money finishes filling and price returns toward fair value. Clusters of medium/large markers at swing points are classic signs of this dynamic.
Practical Analysis Tips
Reversals/Absorption | Clusters of large markers at swing highs/lows (especially opposing-color spikes) signal potential turns – buyers or sellers stepping in aggressively.
Level Defense | Trades piling up at key support/resistance suggest institutions protecting or building positions.
Trapped Traders | Large spikes beyond range pivots followed by reversal back into the range often highlight trapped breakout traders who add fuel to a move when they are forced to liquidate their positions.
Use Offset (-3 to +3) to shift markers away from current price for clearer viewing.
Pro tip: Zoom into the lower TF occasionally to see how these projected levels align exactly with aggressive candles.
Recommended Pairings
This is designed as a pure orderflow overlay to be layered with your existing setup:
Support & Resistance (horizontals, pivots, Volume Profile POC/VAH/VAL)
Market Structure tools (swing points, order blocks, fair value gaps)
Trend filters (EMAs, SuperTrend, higher-TF bias)
Momentum oscillators for timing confluence
Best Suited For
Scalping & day trading (1–15 min charts with 5–30S lower TF)
Swing trading entries (1H–4H charts with 1–5 min lower TF)
High-liquidity markets: crypto perpetuals, forex majors, volatile stocks
Add this indicator to start seeing the hidden aggression driving price and expose the hidden edges beyond the noise.
☠ FR33FA11 | deKoder ☠
Released January 2025 | Open Source

VWAP roller autoBrief Description
VWAP Roller Auto is a TradingView Pine Script indicator that combines a rolling (resetting) Volume Weighted Average Price (VWAP) with dozens of dynamic support/resistance levels derived from Gann's Square of 9 principles. The VWAP resets periodically (automatically or manually) starting from a user-defined session open time, and the Gann levels "roll" with it, creating an adaptive grid of potential price reaction zones. It's designed for intraday trading and overlays directly on the price chart.
Key Features
Rolling VWAP with Custom Session Start
VWAP calculation restarts at configurable session open (default 8:30 CST, using proper Chicago timezone handling).
Auto-Adaptive Period Selection
Automatically chooses the VWAP reset period (from 2 min up to 48 hours) based on current volatility (ATR + realized range). Targets a user-defined spacing (~0.08% by default) between consecutive VWAPs to keep the grid relevant to market conditions. Falls back to manual period if disabled.
Gann Square of 9 Levels
Generates ~8 pairs of resistance (R) and support (S) levels above/below the current rolling VWAP using octave-based increments.
Two increment modes:
Points mode — fixed point steps that double octavely (e.g., 0.305, 0.610, 1.22, 2.44, etc.).
Percent mode — percentage steps scaled so the middle octave aligns near 0.025% for finer resolution on lower-priced assets.
Visual Enhancements
Colored fills between key level groups (e.g., inner ±0.25 octave in blue, ±1–2 octave zones in gray, higher extremes in yellow/red).
Labels on the right side marking important zones ("low", "normal", "high", "3/4 - ps1", "extreme - ps2").
Central VWAP line (customizable color and offset).
Table showing current period length and whether auto mode is active.
Non-Timeframe Friendly
Works on range bars, Renko, etc., using fallback settings when timeframe is non-standard.
Use Cases
Intraday Support/Resistance Trading
Treat the rolling VWAP as fair value and use the Gann-derived levels as dynamic zones for potential reversals, breakouts, or mean reversion.
Scalping and Day Trading
Auto-period ensures the grid spacing matches current volatility — tighter levels in quiet markets, wider in volatile ones — ideal for futures (ES, NQ), crypto, or forex.
Zone-Based Entries/Exits Buy near labeled support zones (e.g., "low" or "normal" volatility bottoms) when price trades below VWAP.
Sell/short near resistance zones in overbought conditions.
Watch for hits of "extreme" zones (±8 octave) as potential strong reversal signals.
Confluence Tool
Combine with order flow, volume profile, or other indicators; the colored fills highlight "value areas" similar to market profile concepts but anchored to a rolling VWAP.
In short, VWAP Roller Auto provides a sophisticated, self-adjusting Gann-inspired grid that moves with the market's fair value, helping traders identify high-probability reaction zones throughout the trading session.

Statistical Reversion FrameworkIntroduction and Core Philosophy
The Statistical Reversion Framework constitutes a sophisticated quantitative trading instrument designed to identify high-probability mean reversion opportunities across financial markets. Unlike traditional technical indicators that rely on a single dimension of market data, this framework adopts a multi-faceted approach, synthesizing statistical probability, volume profile analysis, institutional money flow proxies, and standard technical momentum into a singular composite score. The core philosophy driving this script is the concept of confluence through heterogeneity; by combining uncorrelated or loosely correlated market factors—such as price deviation (statistics), participant commitment (volume), and macro sentiment (intermarket data)—the algorithm aims to filter out the noise inherent in standard oscillators and isolate moments where market pricing has deviated unsustainably from its intrinsic equilibrium. This tool is specifically engineered to detect market extremes—tops and bottoms—where the probability of a counter-trend move or a snap-back to the mean is mathematically significant. It operates on the premise that while asset prices can remain irrational in the short term, they are bound by statistical variance and mean-reverting properties over longer horizons, particularly when institutional flows and volume exhaustion patterns align with those statistical extremes.
Methodology: The Composite Scoring Architecture
The underlying methodology of the framework relies on a weighted composite scoring system. Rather than generating binary buy or sell signals based on a threshold crossover, the script calculates a granular score ranging from zero to one hundred for various market dimensions. These dimension-specific scores are then weighted according to user-defined inputs to produce a final "Composite Score." This approach allows for a nuanced assessment of market conditions; a setup might have extreme statistical deviation but lack volume confirmation, resulting in a lower confidence score than a setup where price, volume, and macro factors all align. The algorithm normalizes all input data into a standardized scale, typically converting raw values—such as Z-Scores or volume ratios—into a zero-to-ten ranking before aggregating them. This normalization process is critical because it allows the algorithm to compare apples to oranges mathematically, treating a standard deviation of 3.0 and a Relative Strength Index (RSI) of 20 as compatible inputs within the same equation. By summing these normalized values and applying regime-based confidence adjustments, the framework produces a dynamic signal that adapts to the volatility and trend intensity of the current market environment.
Algorithmic Component I: Statistical Analysis via Multi-Timeframe Z-Scores
The backbone of the framework is the Statistical Component, which utilizes the Z-Score (or Standard Score) to quantify the degree of price deviation. The Z-Score measures how many standard deviations the current price is from its moving average. A crucial aspect of this algorithm is its fractal nature; it does not rely on a single lookback period. Instead, it computes Z-Scores across three distinct timeframes—Daily, Weekly, and Monthly—and within each timeframe, it calculates deviations for short, medium, and long-term periods. For instance, on the daily timeframe, it assesses deviation from 50-day, 200-day, and 500-day means simultaneously. This multi-timeframe approach is designed to filter out ephemeral noise. A price move that appears extreme on a 10-day basis but is normal on a 200-day basis is likely a trend pull-back rather than a reversal. Conversely, when the Z-Scores across daily, weekly, and monthly timeframes all register values beyond significant thresholds (such as 2.0 or 3.0 standard deviations), it indicates a rare fractal alignment where the asset is historically overextended on all relevant scales. The algorithm aggregates these nine distinct Z-Score data points to form the "Statistical Score," heavily rewarding scenarios where multiple timeframes show directional alignment, as these synchronized deviations often precede powerful mean-reversion events.
Algorithmic Component II: Volume Signature and Participation Analysis
While statistical deviation highlights where the price is, the Volume Component analyzes the conviction behind the move to determine if a reversal is imminent. This section of the code employs several sophisticated logic gates to identify specific volume signatures known as Capitulation and Exhaustion. The algorithm compares current volume against a 50-day moving average to generate a volume ratio. It then correlates this ratio with price action. For example, the script identifies "Capitulation" when price collapses significantly (more than 2%) on volume that is at least three times the average. This specific signature—panic selling—often marks the psychological wash-out necessary for a market bottom. Conversely, the script detects "Volume Exhaustion" when prices drift without conviction on extremely low volume, indicating a lack of participant interest in pushing the trend further. Furthermore, the algorithm integrates On-Balance Volume (OBV) analysis, specifically looking for divergences. It detects subtle shifts where the price makes a new low, but the OBV makes a higher low, signaling that smart money is accumulating positions despite the falling price. This divergence logic is automated using pivot-based high/low detection arrays, adding a layer of foreshadowing that price-only indicators often miss.
Algorithmic Component III: Institutional Proxy and Intermarket Correlations
The Institutional Component distinguishes this framework from standard retail indicators by incorporating intermarket data that serves as a proxy for macro sentiment and institutional flow. The script pulls data from extraneous tickers—specifically the VIX (Volatility Index), Government Bond Yields (10-year and 2-year), Copper, Gold, and the Dollar Index (DXY). The logic here is grounded in fundamental market mechanics. For instance, the script analyzes the VIX to gauge market fear; however, it applies a contrarian logic. An extremely high VIX (panic) coincident with a low equity price is scored as a bullish factor, while a complacently low VIX at market highs is viewed as bearish. Similarly, the algorithm analyzes the Yield Curve (the spread between 10-year and 2-year yields). A steepening or flattening curve provides context on economic expectations, influencing the score based on whether the environment is "risk-on" or "risk-off." The Copper/Gold ratio is utilized as a barometer for global economic health; rising copper relative to gold suggests industrial demand and growth, confirming bullish setups, whereas falling copper prices signal contraction. By integrating these non-price variables, the framework ensures that a trade signal is not just technically sound but is also supported by the broader macroeconomic undercurrents that drive institutional capital allocation.
Algorithmic Component IV: Technical Momentum and Structure
The final layer of input comes from standard Technical Analysis, which serves to fine-tune the timing of the entry. This component aggregates readings from the Relative Strength Index (RSI), Moving Average Convergence Divergence (MACD), Bollinger Bands, and Support/Resistance proximity. While Z-Scores measure linear distance from the mean, the RSI and Bollinger Bands measure the velocity and elasticity of that move. The algorithm assigns higher scores when RSI hits extreme levels (below 20 or above 80) and when price action pierces the outer bounds of the Bollinger Bands. Additionally, the MACD is monitored for histogram reversals and signal line crosses that align with the mean reversion bias. A unique feature of this component is the proximity logic, which calculates how close the current price is to a 50-period high or low. If a statistical extreme coincides with a retest of a major structural support level, the technical score is maximized. This ensures that the trader is not catching a falling knife in a void, but rather identifying a reversal at a location where technical structure provides a natural floor or ceiling for price.
Regime Detection and Confidence Adjustment
A critical vulnerability of mean reversion strategies is that they can suffer severe drawdowns during strong, unidirectional trending markets (momentum regimes). To mitigate this, the framework incorporates a Regime Detection module using the Average Directional Index (ADX) and volatility thresholds. The script calculates the ADX to measure trend strength regardless of direction. If the ADX is above a certain threshold (default 25), the market is classified as "Trending." The script then cross-references this with volatility data to classify the environment into regimes such as "Crisis," "Trending," "Range," or "Mean-Revert." This classification is not merely cosmetic; it actively influences the final output through a "Regime Confidence" multiplier. If the system detects a strong trending regime, it dampens the Composite Score, requiring extraordinary evidence from the other components to trigger a signal. Conversely, if the market is detected as "Mean-Revert" or "Low-Vol Range," the confidence multiplier boosts the score, making the system more sensitive to reversion signals. This adaptive logic helps protect the trader from fading strong breakouts while aggressively capitalizing on ranging markets.
Usage Instructions and Dashboard Interpretation
Traders utilizing this framework should primarily interact with the on-screen Dashboard, which provides a real-time summary of all computed metrics. The dashboard is organized hierarchically, with the "Composite Score" and "Signal Status" at the top. A Composite Score above 70 is generally considered actionable, with scores above 85 representing "Exceptional" setups. The Dashboard is color-coded: green hues indicate bullish/oversold conditions suitable for buying, while red hues indicate bearish/overbought conditions suitable for selling or shorting. Traders should look for "Confluence" across the rows. Ideally, a robust signal will show a high Statistical score (indicating price is cheap/expensive), a high Volume score (indicating capitulation or accumulation), and a supportive Institutional score. If the Composite Score is high but the Institutional score is low, the trader should proceed with caution, as the macro environment may not support the trade.
The chart visuals provide immediate entry triggers. "Strong Bottom" (Green Triangle) and "Strong Top" (Red Triangle) shapes appear when the Composite Score breaches the high threshold and Z-Scores are at extremes. These are the primary execution signals. Smaller "Potential" markers indicate developing setups that may require lower timeframe confirmation. Additionally, specific volume icons (Diamonds) will appear to denote Capitulation or Climax events. A trader should ideally wait for the candle to close to confirm these signals. The alerts configured in the script allow the trader to be notified of these events remotely. For risk management, because this is a mean reversion tool, stop-losses should typically be placed below the swing low of the capitulation candle (for longs) or above the swing high of the climax candle (for shorts), anticipating that the statistical extreme marks the distinct turning point. By systematically waiting for the Composite Score to align with the visual signals and verifying the regime context on the dashboard, the trader effectively filters out low-probability trades, engaging only when statistics, volume, and macro-economics align.

Volume-Weighted Fibonacci PivotThis indicator automatically plots dynamic Fibonacci retracement and extension levels based on a volume-weighted pivot point within a user-defined lookback period or date range. It intelligently calculates a central "pivot" price biased toward high-volume bars, then draws symmetric levels both upward (extensions) and downward (retracements) for balanced confluence analysis.
How It Works (Technical Methodology)
Lookback Period Determination
Multiple filter modes control the data range used for calculations:
"Last X Bars": Fixed number of recent bars (default 400, max 4999).
"Manual Date": User-specified start date.
"Interactive (Chart)": Confirmed start date via input.
"None": Full available history (falls back to max bars).
Optionally, when using "Last X Bars", calculations can pull data from a higher/lower user-selected timeframe via request.security() for multi-timeframe alignment.
A dotted vertical line marks the start point in date-based modes.
Range and Pivot Calculation
Within the selected period:
Highest high and lowest low define the full price range.
Average volume is computed across the period.
Volume-Weighted Pivot: Average close price only from bars where volume > average volume (fallback to simple midpoint if no high-volume bars).
This creates a "smart" central pivot that leans toward areas of greater participation, often aligning with institutional activity.
Fibonacci Level Generation
User-configurable ratios (default: 0.236, 0.382, 0.5, 0.618, 0.786, 1.0, 1.272, 1.414, 1.618).
Levels are calculated symmetrically around the volume-weighted pivot:
Upward: Pivot + (Range × Ratio × Correction Factor) – teal/cyan shades.
Downward: Pivot - (Range × Ratio × Correction Factor) – red shades.
Correction Factor (default 0.5): Scales level spacing for tighter/wider grids without altering ratios.
Only the user-defined number of active lines (default 9) are drawn.
Visual Construction
Central Pivot Line: Thick yellow horizontal line with label showing exact price.
Up/Down Levels: Dashed lines extended into the future, labeled with ratio direction ("Up" or "Dn").
All objects redraw only on the last bar for performance, clearing previous drawings.
Multi-Timeframe Option
When enabled with "Last X Bars":
Pulls high/low/volume data from specified timeframe.
Aligns the pivot and levels to higher-timeframe structure while displaying on current chart – ideal for intraday traders seeking HTF confluence.
How to Use
This tool provides clean, volume-aware Fibonacci grids for identifying potential support/resistance, reversal zones, and targets.
Volume-Weighted Pivot: Often acts as a strong mean reversion level or fair value area.
Upward Levels (Teal): Potential resistance/extensions in bullish moves; watch for reactions on retests.
Downward Levels (Red): Potential support/retracements in bearish moves.
Confluence: High probability when price reacts at levels aligning with other tools (order blocks, pivots, volume profile).
Correction Factor: Lower values (<0.5) for tighter grids in ranging markets; higher (>0.5) for trending markets.
Multi-Timeframe Mode: Use on lower charts (e.g., 15m) with HTF input (e.g., 4H or Daily) to project major structure levels.
Common Setups:
Pullbacks to 0.618–0.786 zones for continuation entries.
Breaks beyond 1.0–1.618 for extension targets.
Reactions near pivot line for mean reversion trades.
Adjust ratios and active line count to match your preferred Fibonacci style (classic retracement vs. extensions).
Disclaimer
This indicator is a technical analysis tool and should be used in conjunction with other forms of analysis. Past performance does not guarantee future results. Always use proper risk management.
